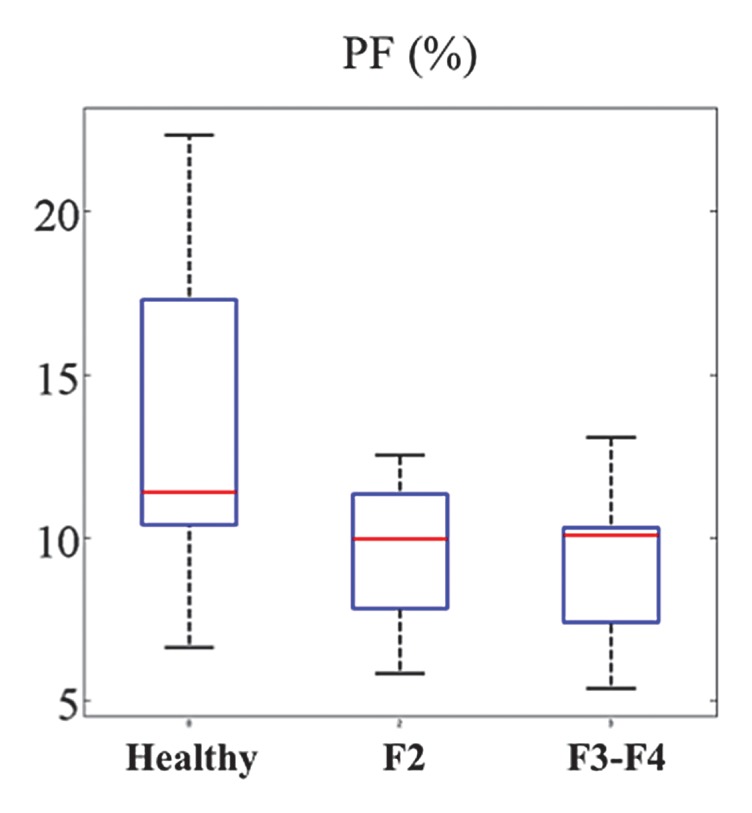
Figure 5a:

Box plot distribution of IVIM parameters for the RT DW sequence in 13 patients with HCV and seven healthy volunteers. (a) PF, (b) D, and (c) D*. While PF and D have decreased values for patients with HCV, the distributions for D* overlap between healthy volunteers and patients with HCV. Top and bottom of boxes represent 25% and 75% percentiles of data values, respectively, with the horizontal line in boxes representing the median. The whiskers extend to the most extreme data points. F2 = F2 fibrosis, F3-F4 = F3–F4 fibrosis.
