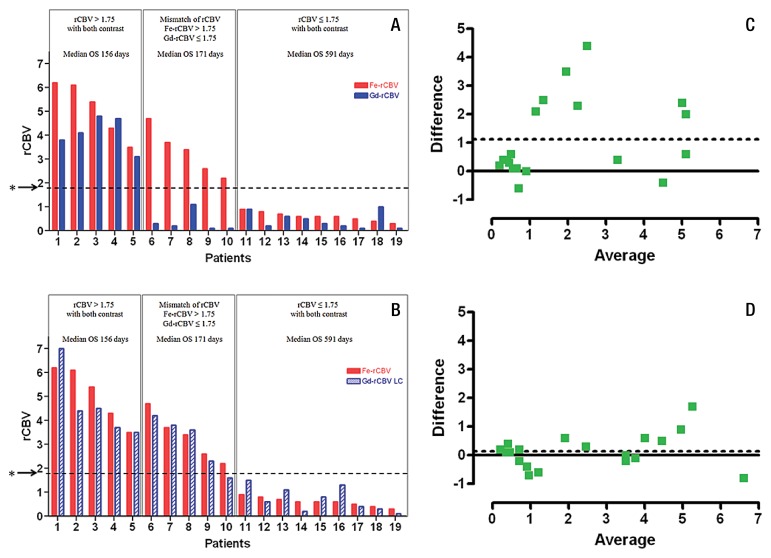
Figure 1:
Bar graphs and scatterplots show summary of rCBV values estimated at perfusion MR imaging with both contrast agents. Bar graphs A and B show tumor rCBVs with ferumoxytol (red bars, Fe rCBV), gadoteridol (blue bars, Gd rCBV) and gadoteridol with leakage correction (striped blue bars, Gd-rCBV LC) for each patient. Patients with high rCBV (>1.75) with both contrast agents had poor overall survival (OS). Patients with low rCBV (≤1.75) with both contrast agents had significantly longer overall survival. Patients with high rCBV with ferumoxytol and low rCBV with gadoteridol had poor prognosis. Asterisks indicate rCBV cutoff value of 1.75. Bland-Altman plots show average differences between rCBV values for, C, ferumoxytol and gadoteridol as 1.12 and, D, ferumoxytol and gadoteridol with leakage correction as 0.14.

