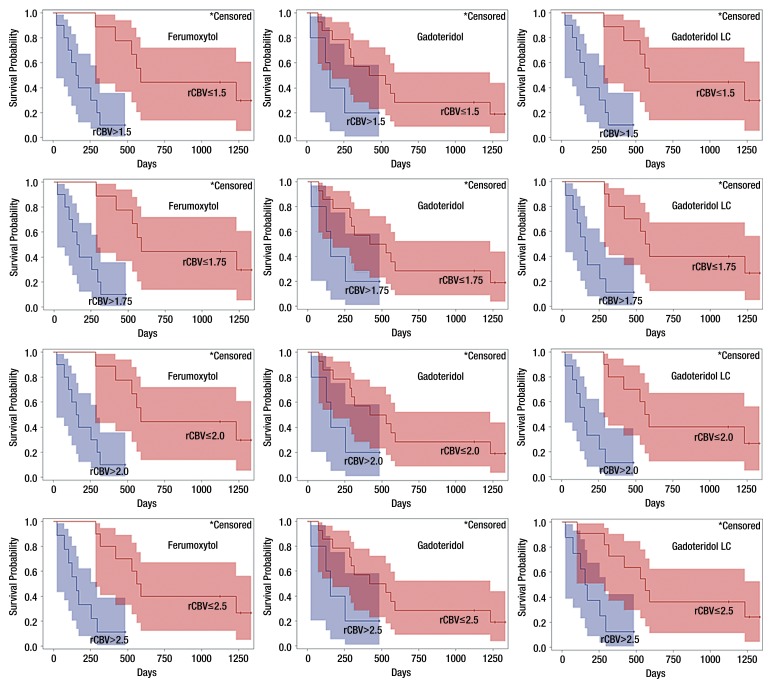
Figure 5:
Charts show survival of GBM patients according to rCBV by using four cutoff values. Tumor rCBV was measured by using ferumoxytol versus gadoteridol and gadoteridol with leakage correction (LC). Kaplan-Meier survival curves show best survival prediction by using rCBV values obtained with ferumoxytol (P < .001) when cutoff range is between 1.5 and 2.0, and the same result was achieved with gadoteridol leakage correction with cutoff of 1.5. By using gadoteridol, survival prediction is similar but not statistically significant (P = .079) for all cutoff values. Colored areas indicate 95% CIs.

