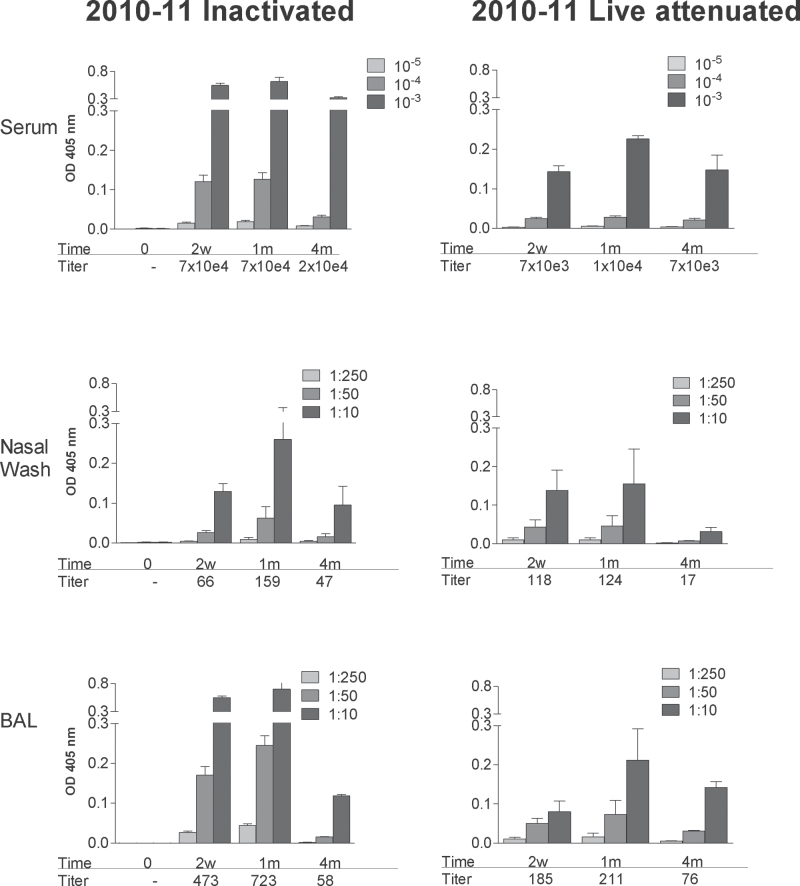
Fig. 5.
Serum and respiratory tract IgG responses elicited by inactivated and live attenuated 2010–11 influenza virus vaccines. Serum (top panels), nasal wash (middle panels) and BAL (bottom panels) samples were tested for virus-specific IgG responses by ELISA at various intervals (0 weeks, 2 weeks, 1 month, 4 months; x-axes) after vaccination with inactivated (left panels) or live attenuated vaccines (right panels) from the 2010–11 season. Animals were tested individually and results are shown as group means with standard error bars. Antibody titers were calculated using non-linear regression software and are shown below each bar set.

