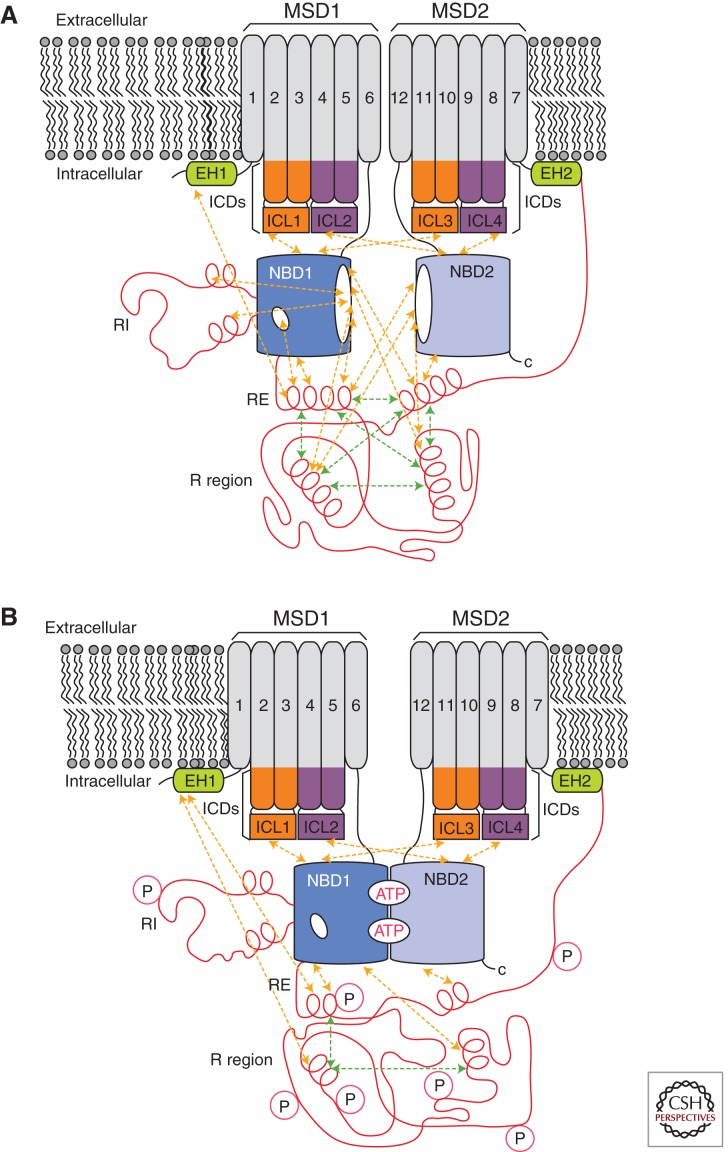
Figure 1.
Schematic representation of nonphosphorylated (A) and phosphorylated (B) CFTR. The membrane-spanning domains (MSDs) and nucleotide-binding domains (NBDs) are shown in gray and blue, respectively. The R region, regulatory insertion (RI), and regulatory extension (RE) are shown in red. The intracellular domains (ICDs) are shown in orange or purple with the coupling helices or intracellular loops (ICLs) identified. The elbow helices (EHs) are shown in green. Intramolecular interactions are indicated by dashed arrows.

