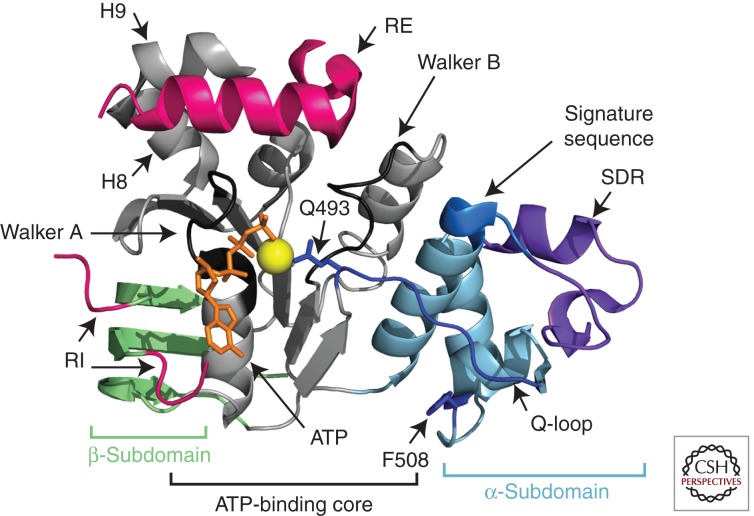
Figure 3.
Ribbon diagram representation of CFTR NBD1. The ATP-binding core, α-subdomain, and β-subdomain are shown in gray, blue, and green, respectively. The regulatory extension (RE) and the amino and carboxyl termini of the regulatory insertion (RI) are shown in pink. The central portion of the RI is disordered and is not shown. ATP and magnesium are shown in orange and yellow, respectively. Other features, including the structurally diverse region (SDR), the Q-loop within the α-subdomain, and helices 8 and 9 (H8 and H9), are indicated by the labeled arrows. (PDB 2BBO [Lewis et al. 2010].)

