Figure 4.
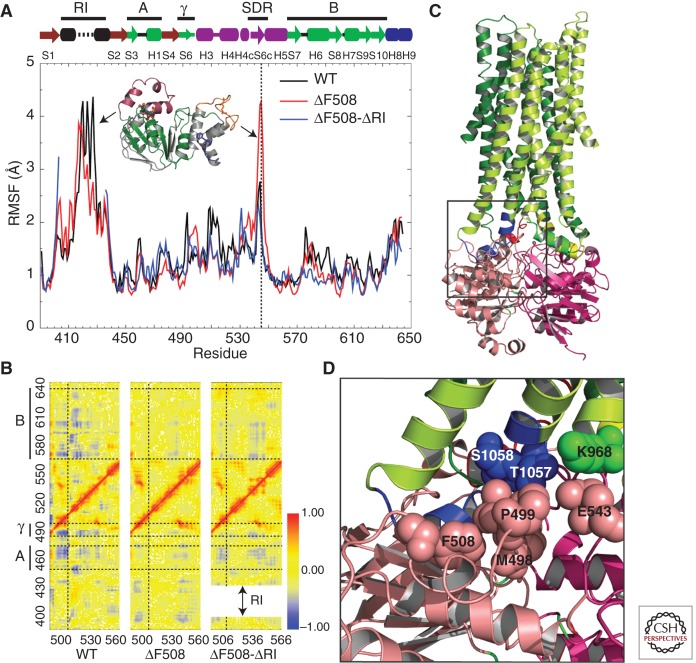
CFTR NBD1 dynamics. (A) Root mean square fluctuations (RMSFs) of every residue in NBD1 as a function of time, obtained from MD simulations. The vertical dotted line indicates fluctuations of the SDR loop. Black arrows represent RMSF peaks for the corresponding structural regions in the plot. The ATP-binding core subdomain (A, G451–L475; B, D565–Q637) and γ-switch (Q493–P499) are colored green and labeled by the bold lines at the top for reference. (B) Pairwise Cα correlation map for residues 490–560 in comparison with those of all other regions in NBD1. Horizontal dotted lines separate the ATP-binding core subdomain (A and B) and γ-switch, as indicated by the bold lines on the left of the y-axis. The vertical dotted line corresponds to position F508. The shift in the y-axis of the F508del–ΔRI correlation map is a consequence of RI deletion. Red dots (correlation coefficient = 1) indicate residue pairs that move in concert in the same direction, and blue dots (correlation coefficient = −1) indicate residue pairs that move with opposite velocities all the time. (C) Structural model of full-length CFTR (http://dokhlab.unc.edu/research/CFTR/home.html). The area of the NBD1–ICL3–ICL4 interface is shown in the inset. (D) A detailed view of the location and orientation of the residues in the NBD1–ICL3–ICL4 interface from C. Residues F508, P499, M498, and E543 from NBD1 (salmon), S1058 and T1057 from ICL4 (blue), and K968 from ICL3 (cyan) are shown as spheres. (From Aleksandrov et al. 2010; reproduced, with permission.)

