
FIG 1.
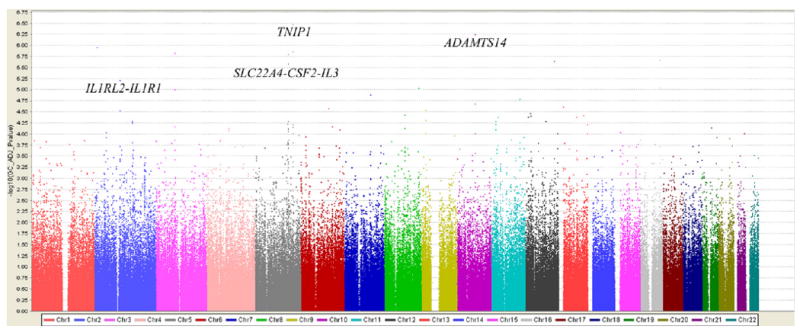
Genome-wide association of 474,271 SNPs in 813 SARP/CSGA/CAG cases, 553 SARP/CSGA/CAG control subjects, and 1,011 Illumina control subjects. The color scale of the x-axis represents chromosomes. Negative log-transformed genomic control–adjusted P values are shown on the y-axis.