
FIG E1.
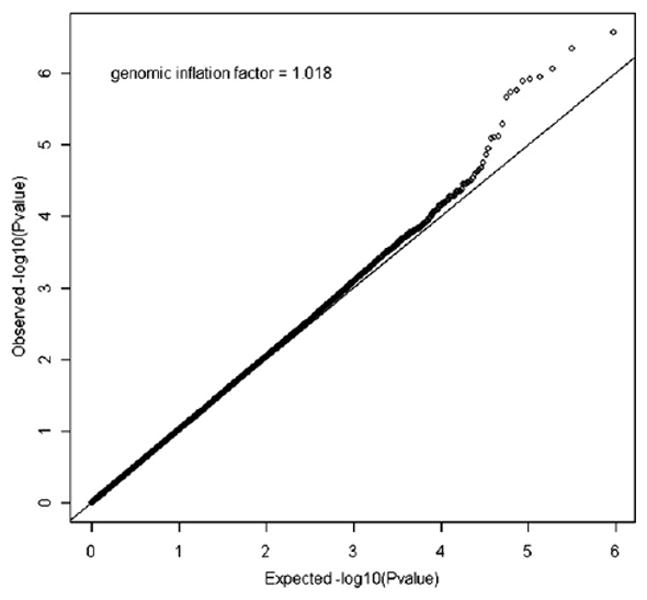
QQ-plot of the GWAS of asthma in SARP/CSGA/CAG. Negative log-transformed expected P values are shown on the x-axis. Negative log-transformed observed P values are shown on the y-axis.
Official websites use .gov
A
.gov website belongs to an official
government organization in the United States.
Secure .gov websites use HTTPS
A lock (
) or https:// means you've safely
connected to the .gov website. Share sensitive
information only on official, secure websites.
QQ-plot of the GWAS of asthma in SARP/CSGA/CAG. Negative log-transformed expected P values are shown on the x-axis. Negative log-transformed observed P values are shown on the y-axis.