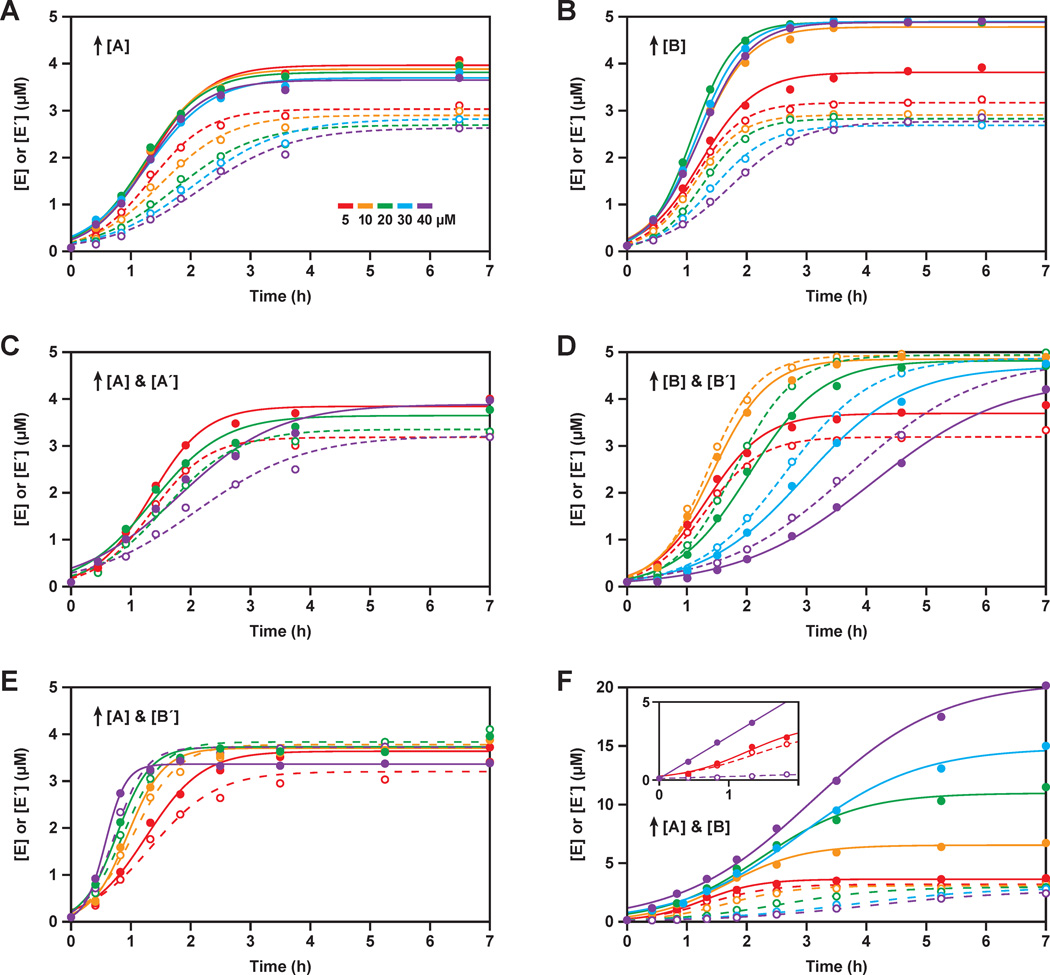
Figure 6.
Exponential amplification carried out in the presence of unbalanced concentrations of the four substrates. Unless otherwise stated, all reactions employed 0.1 µM each of E and E´, 5 µM each of A, A´, B, and B´, and 25 mM MgCl2, and were carried out at pH 8.5 and 44 °C. The starting concentrations of one or two substrates were increased from 5 µM (red), to 10 µM (orange), 20 µM (green), 30 µM (blue), or 40 µM (violet). The data were fit to the logistic growth equation, with solid and dashed lines indicating the production of E and E´, respectively. (A) Increasing [A]; (B) increasing [B]; (C) increasing both [A] and [A´]; (D) increasing both [B] and [B´]; (E) increasing both [A] and [B´]; (F) increasing both [A] and [B]. For clarity, not all concentrations are plotted in (C) and (E). Inset in (F) shows a linear fit to the data for the reaction employing 40 µM A and B (violet), in comparison to the reaction with 5 µM A and B (red).

