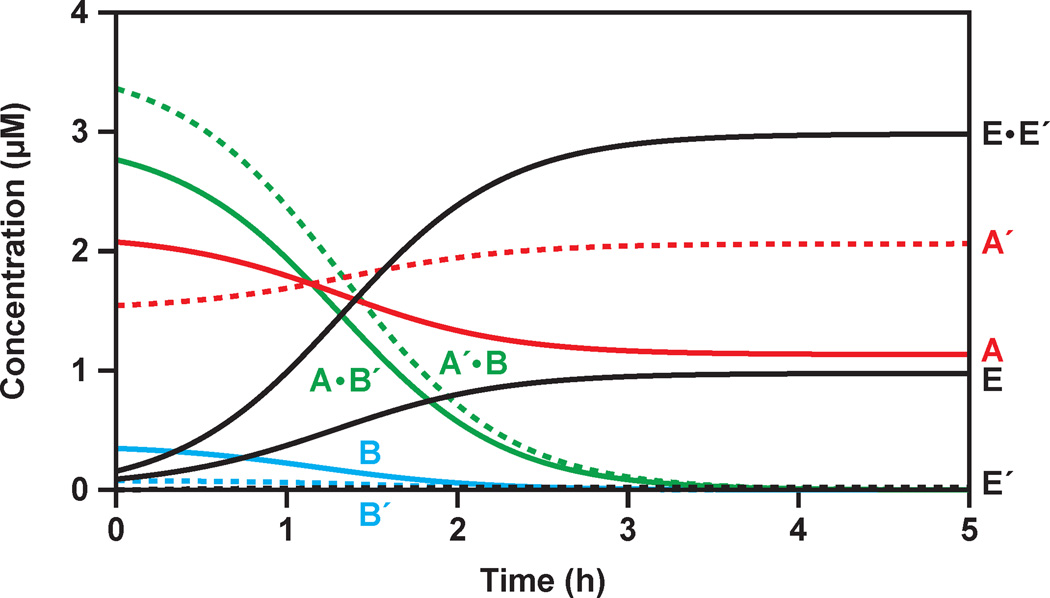
Figure 7.
Estimation of the concentrations of various reaction components during the course of exponential amplification, based on the data shown in Figure 2A and the experimentally determined Kd values for the E•E´, A•B´, and A´•B complexes. The starting concentrations of A and A´ (red) were 5 µM each; the starting concentrations of B and B´ (blue), adjusted for their maximum extent of reaction, were 3.5 and 3 µM, respectively; and the starting concentrations of E and E´ (black) were 0.1 µM each. At the outset of the reaction most of the substrates existed as A•B´ and A´•B complexes (green), with the excess A and A´ molecules remaining free in solution.

