
Figure 3. A.
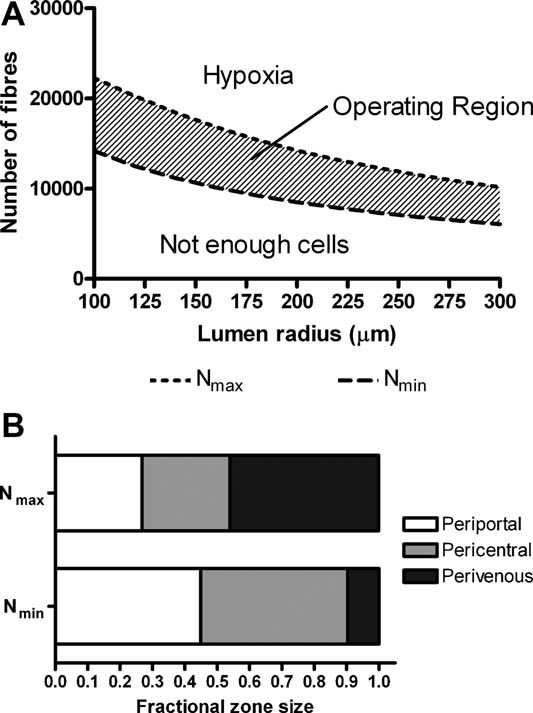
: Operating region chart, produced in a previous study using the parameters of Table I. B: The distribution of the metabolic zones at both extremes of the operating region, for a fiber radius of 200 µm.
Official websites use .gov
A
.gov website belongs to an official
government organization in the United States.
Secure .gov websites use HTTPS
A lock (
) or https:// means you've safely
connected to the .gov website. Share sensitive
information only on official, secure websites.
: Operating region chart, produced in a previous study using the parameters of Table I. B: The distribution of the metabolic zones at both extremes of the operating region, for a fiber radius of 200 µm.