
Figure 4. A.
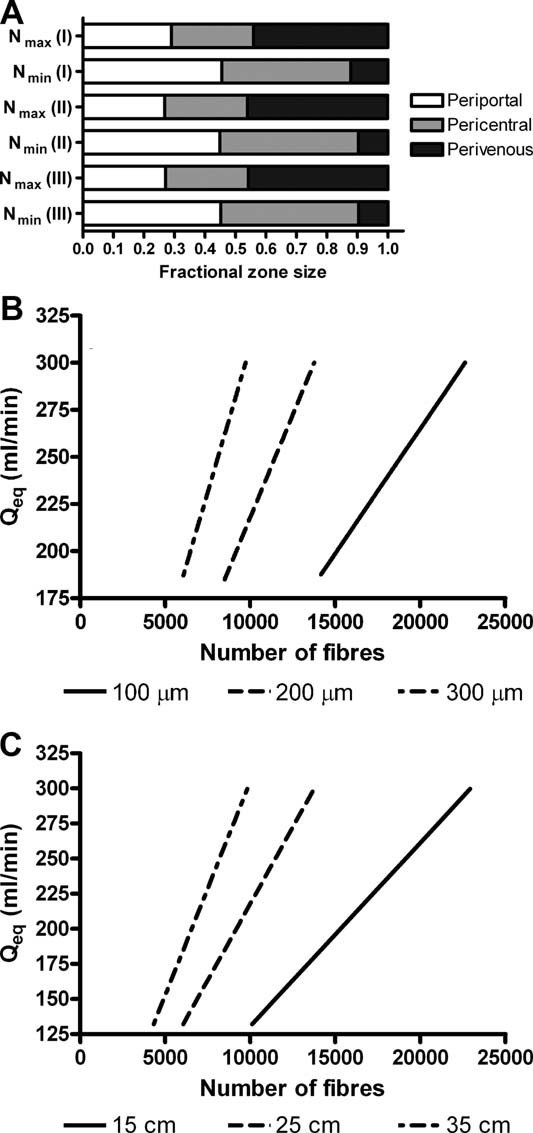
: Distribution of metabolic zones in the case of (I) Rl = 100 µm, (II) Rl = 200 µm, and (III) Rl = 300 µm. B: The flow rate required to produced balanced periportal and perivenous zones (Qeq) is shown as a function of fiber number and (C) fiber length.