
Figure 5.
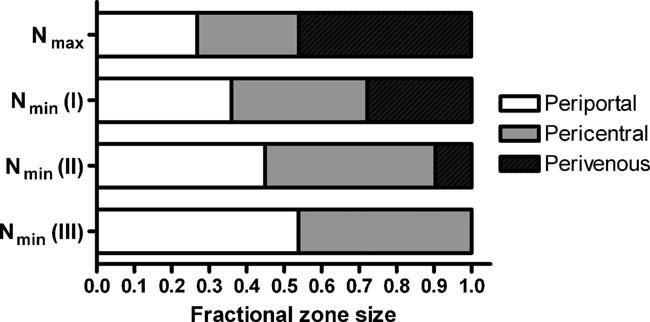
Distribution of metabolic zones in the case of (I) Q = 200 mL/min, (II) Q = 250 mL/min and (III) = 300 mL/min. The zone distribution is unaffected by Q when operating on the Nmax limit and hence the bar is drawn only once.
Official websites use .gov
A
.gov website belongs to an official
government organization in the United States.
Secure .gov websites use HTTPS
A lock (
) or https:// means you've safely
connected to the .gov website. Share sensitive
information only on official, secure websites.
Distribution of metabolic zones in the case of (I) Q = 200 mL/min, (II) Q = 250 mL/min and (III) = 300 mL/min. The zone distribution is unaffected by Q when operating on the Nmax limit and hence the bar is drawn only once.