Figure 9. A.

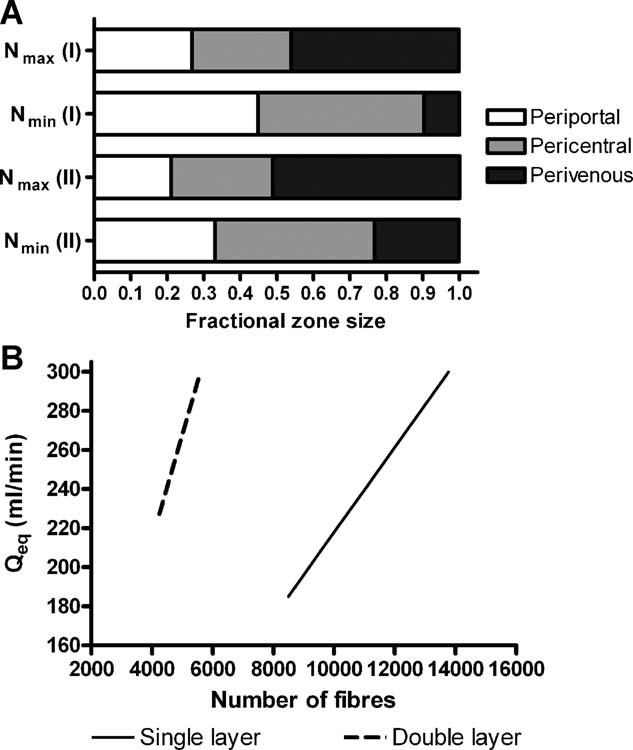
: Distribution of metabolic zones in the case of (I) a single cell layer and (II) a double cell layer model. B: The Qeq plot for each case is also shown.

: Distribution of metabolic zones in the case of (I) a single cell layer and (II) a double cell layer model. B: The Qeq plot for each case is also shown.