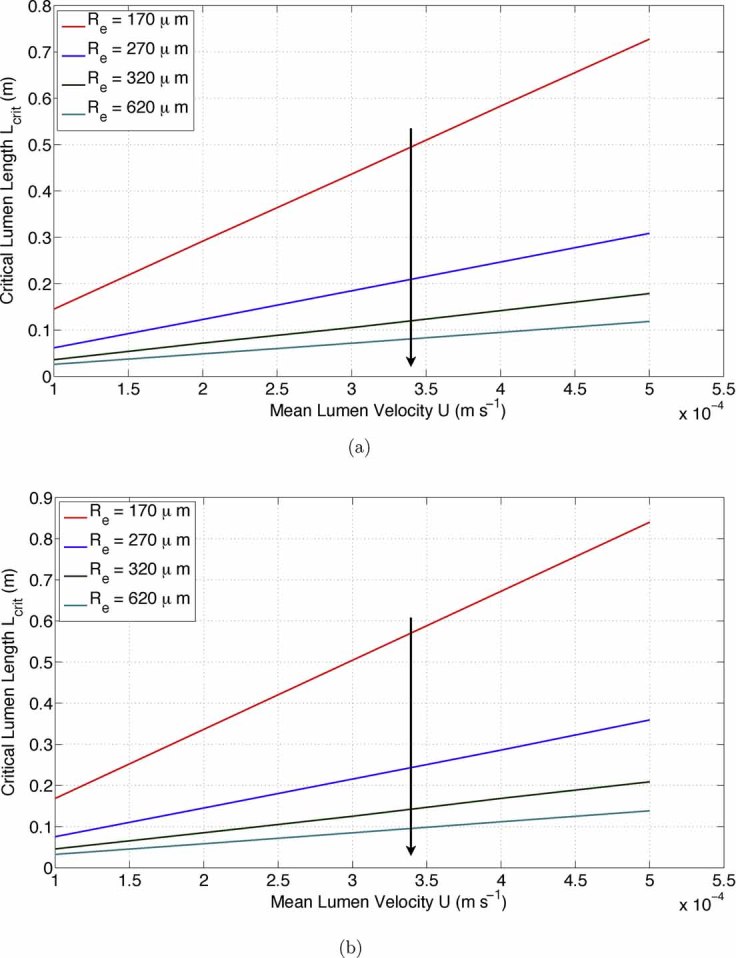
Figure 6.

Numerical results for the bovine chondrocytes that show the relationship between Lcrit and U for two different minimum oxygen requirements (arrows in direction of Re decreasing). a: [cmin = 1 × 10⁻² mol m−3 and cmin/Km = 2.0 held fixed], (b) [cmin = 2.2 × 10⁻³ mol m−3 and cmin/Km = 0.44 held fixed].
