
Fig. 2.
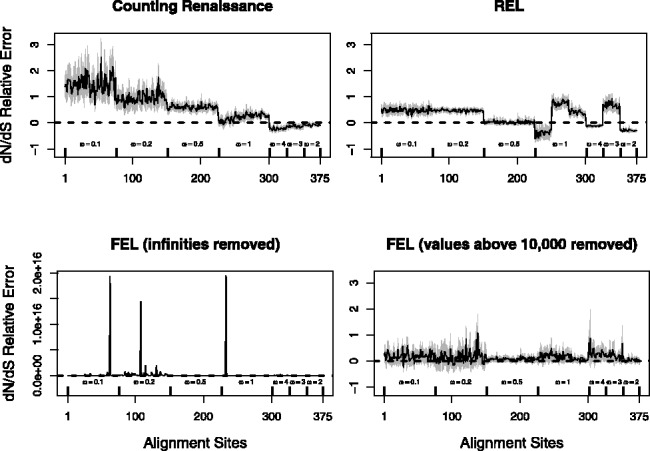
Relative errors of site-specific  estimation. We show mean relative errors (solid black lines), produced by renaissance counting, DUAL REL and FEL for each site of simulated alignments with 128 taxa. The top facing tick marks in each plot demarcate changes in the true
  value. The true values are shown above the intervals produced by the tick marks. Gray shaded areas indicate 95% Monte Carlo error. We do not show the Monte Carlo error in the bottom left plot because outlier estimates, produced by the FEL method, violate normality assumptions of the Monte Carlo error calculations. In all plots, the horizontal dashed line corresponds to zero value of the relative error