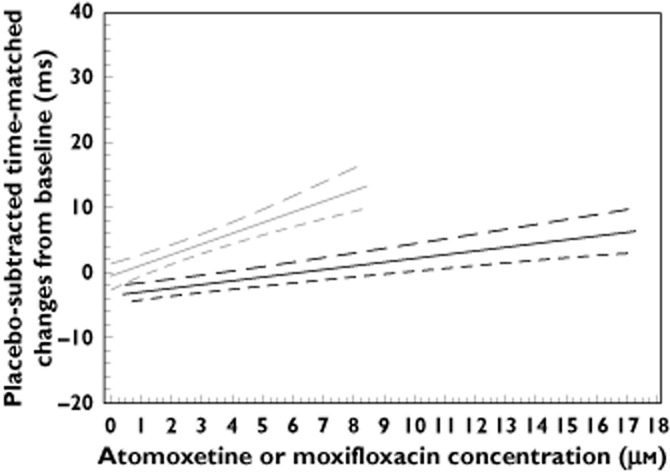
Figure 2.

Plot of ΔΔQTcI vs. plasma atomoxetine and moxifloxacin concentrations following 7 days of atomoxetine (20 mg twice daily or 60 mg twice daily) and a single 400 mg dose of moxifloxacin.  , Atomoxetine least-squares mean;
  , Moxifloxacin least-squares mean;
  , atomoxetine 90% lower bound;
  , moxifloxacin 90% lower bound;
  , atomoxetine 90% upper bound;
  , moxifloxacin 90% upper bound
