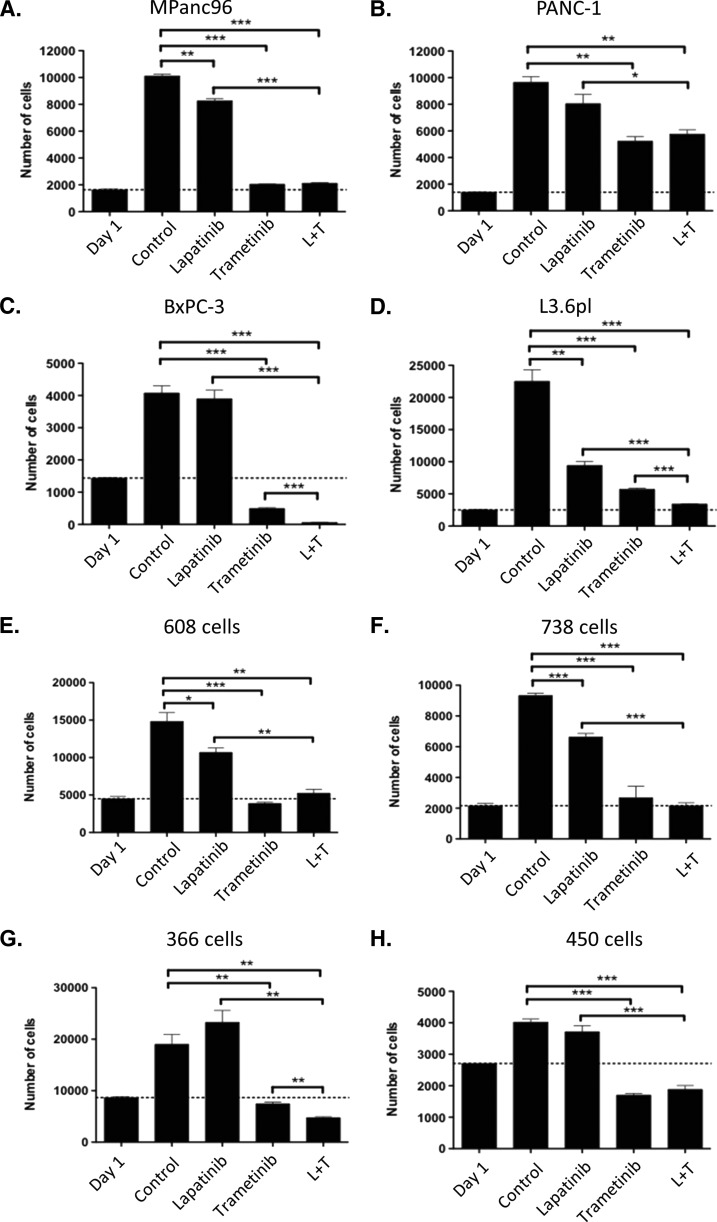
Figure 2.
Proliferation assays for four established pancreatic cancer cell lines (A–D) and four patient-derived pancreatic cancer cell lines (E–H) after treatment with DMSO (control), lapatinib (1.0 µM), trametinib (0.3 µM), or combination of lapatinib and trametinib. P values are given as follows: *P < .05, **P < .01, ***P < .001.

