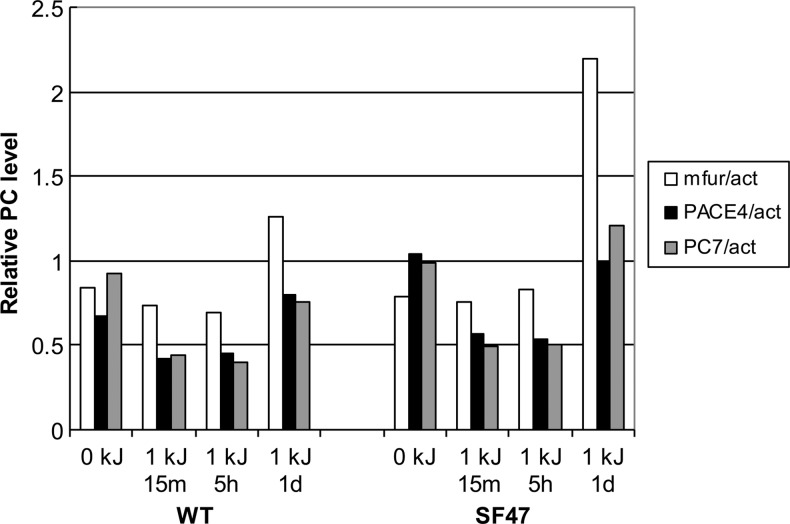
Figure 4.
Quantitative RT-PCR of PCs using mouse normal keratinocytes in short-term culture. All PC transcript expression values (y axis) are expressed as ratios between the respective PC and actin control expression. Note that the expression level of furin is increased at 24 hours (1 day) after UVB exposure in SF47 transgenic-derived keratinocytes but not at the other time points (0 kJ or untreated, 15 minutes and 5 hours). PCs detected were the endogenous mouse proprotein convertases furin (fur), PACE4, and PC7.

