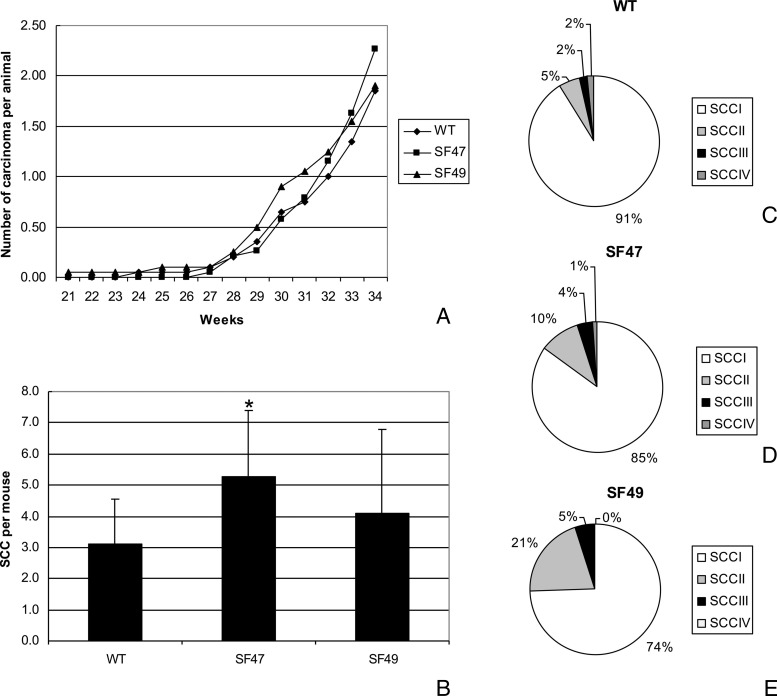
Figure 6.
UV carcinogenesis experiments with single transgenic mice: Panel A depicts the tumor multiplicity as expressed by SCC/mouse during the course of the experiment as counted once weekly and determined by the presence of large (>10 mm) infiltrating or ulcerated lesions of the dorsal skin. Panel B shows the number of SCC/mouse at the last time point (34 weeks) as determined by the histopathologic evaluation of all tumors. Pie charts showing the distribution of SCCs of different histopathologic grades in WT SKH-1 mice (C), transgenic SF47 mice (D), and transgenic SF49 mice (E).

