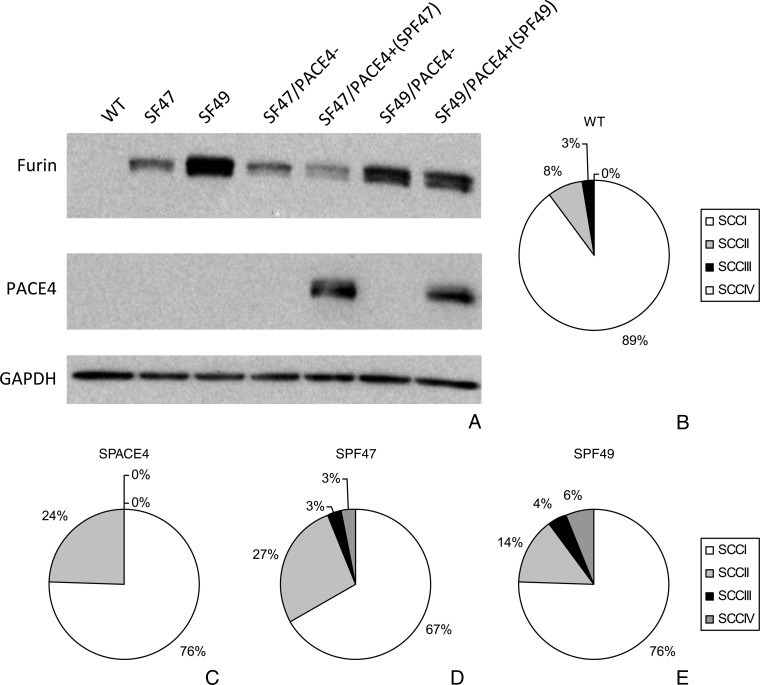
Figure 7.
UV carcinogenesis experiments with double transgenic mice: Western blot of epidermal skin keratinocytes derived from single and double transgenic mice (A). Pie charts showing the distribution of SCCs of different histopathologic grades in the mice groups used to evaluate PACE4 and furin double transgenic mice. WT SKH-1 mice (B), single transgenic SPACE4 (C), double transgenic SPF47 (D), and double transgenic SPF49 (E). Note the increase in the percentage of higher grade SCCs in the double transgenic line.

