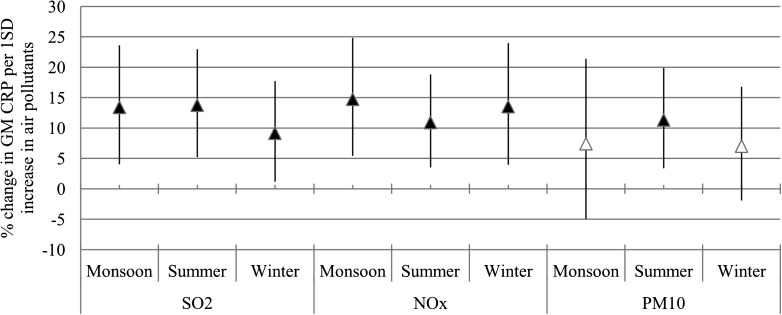
Figure 3.
Effect of the season on the association between air pollutants and CRP concentrations. The estimates are given as percent change in the GM of CRP per 1 SD increase of SO2 (lag2), NOx (lag2), and PM10 (lag4). Error bar indicates 95% CI. Black triangle indicates significant association (P < 0.05).

