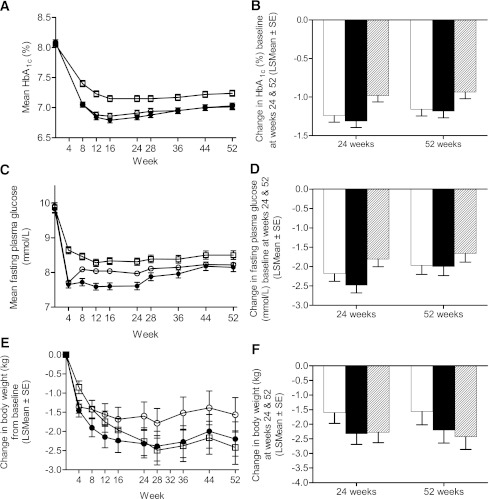
Figure 1.
Glycemic control and body weight. A: HbA1c values from baseline to week 52. B: Change in HbA1c values from baseline to weeks 24 and 52. C: Fasting plasma glucose concentrations from baseline to week 52. D: Change in fasting plasma glucose concentrations from baseline to weeks 24 and 52. E: Body weight from baseline to week 52. F: Change in body weight from baseline to weeks 24 and 52. A, C, and E: Open circle, taspoglutide 10 mg once weekly (n = 384), baseline 8.1%; closed circle, taspoglutide 20 mg once weekly (n = 392), baseline 8.1%; open square, exenatide 10 μg twice daily (n = 373), baseline 8.1%. B, D, and F: White bar, taspoglutide 10 mg; black bar, taspoglutide 20 mg; striped bar, exenatide.

