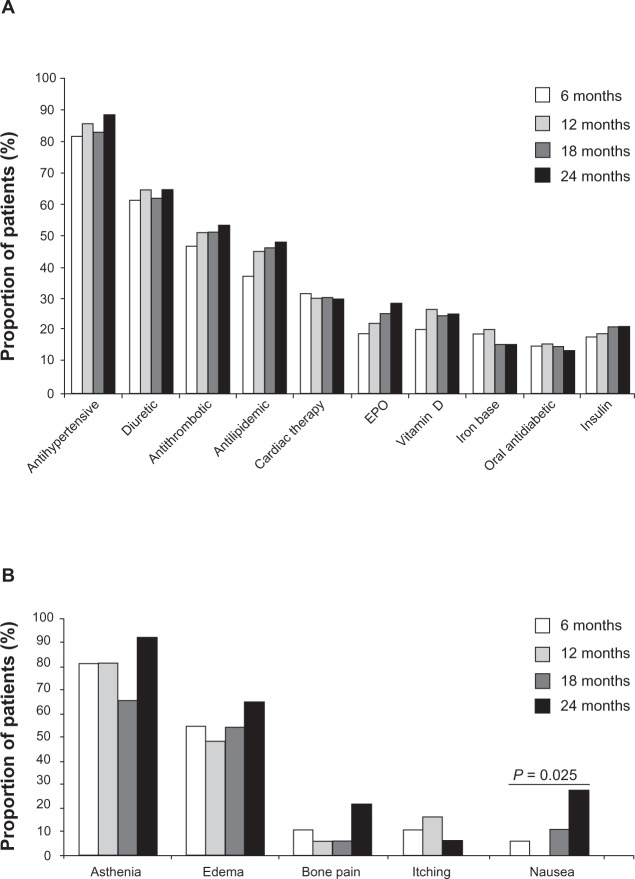
Figure 3.
Treatment and adverse events in patients over the four visits. (A) Medication received in patients over the four visits. (B) Adverse events reported in patients over the four visits.
Notes: Data are expressed as percentage and taken from patients who attended all four visits (n = 92). P value indicates a significant difference observed over the four visits (Fisher’s exact test).

