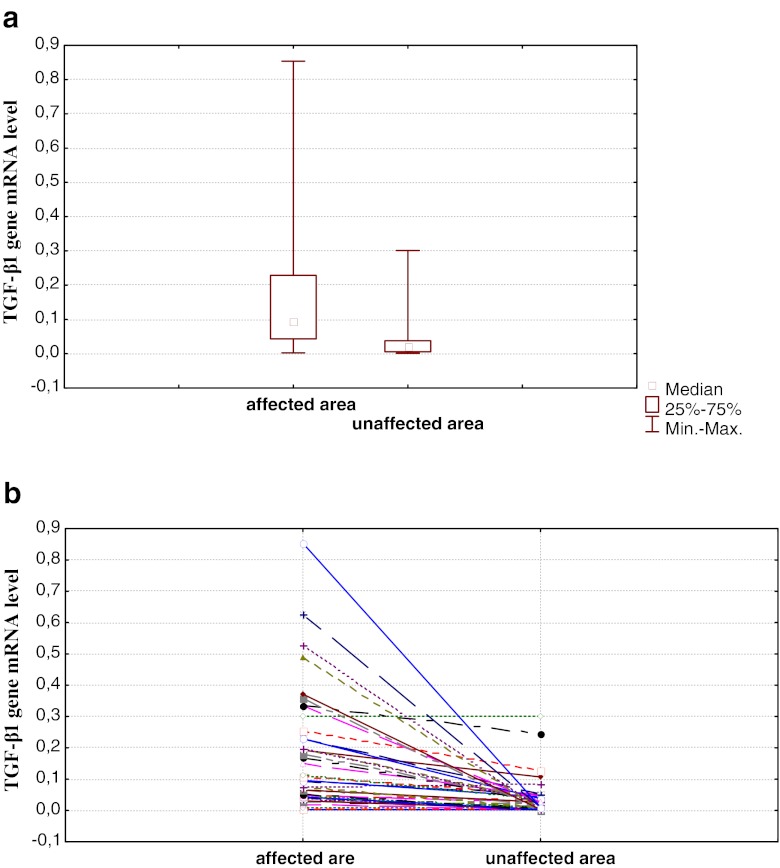
Fig. 1.
TGF-β1 mRNA level in samples from the affected and unaffected areas during active stage of disease in the IBD group (collective data). a Values for the whole group and b results for individual patients. Results from three independent measurements in each sample (including RNA extraction) are presented. In (a), the difference between values presented for affected and unaffected areas was statistically significant (p < 0.001)

