Figure 1.

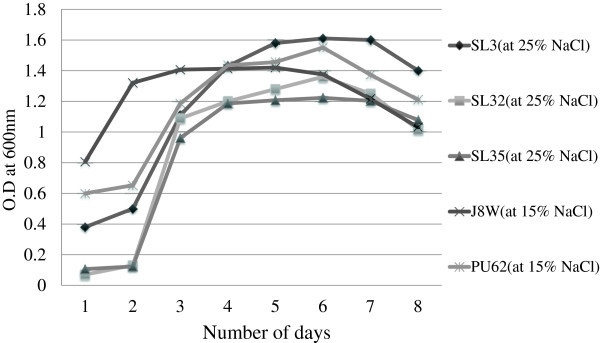
Growth curve of selected isolates at different NaCl concentration. The graph shows the maximum growth of each isolates in their respective tolerance levels of NaCl. Each point is the mean of three replicates.

Growth curve of selected isolates at different NaCl concentration. The graph shows the maximum growth of each isolates in their respective tolerance levels of NaCl. Each point is the mean of three replicates.