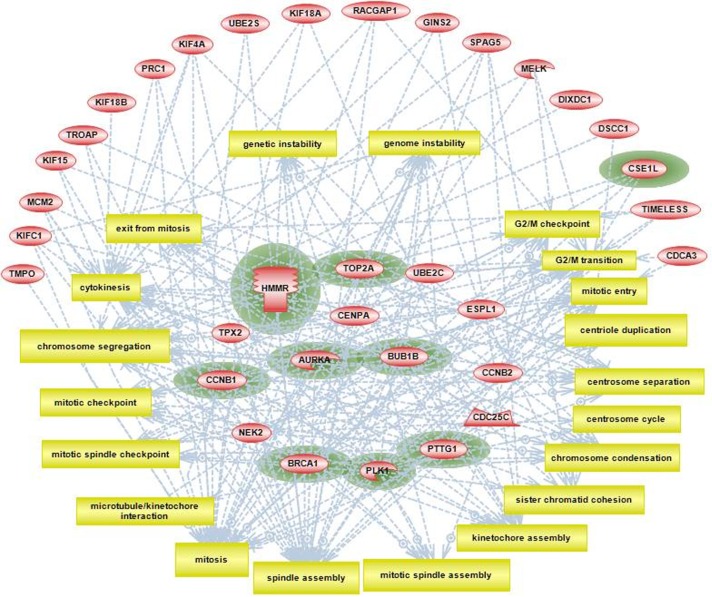
Figure 8.
Pathway Studio analysis showing top 20 cellular processes all related to consecutive steps of progression through mitosis.
Notes: Nodes representing genes from the 44 intersection gene list are grouped according to number of downstream processes they are associated with: outside circle of nodes includes all nodes with <5 downstream processes; group of nodes in the middle includes highly interactive nodes with >5 processes. Genes that are significantly associated with metastasis phenotype (based on published data) are highlighted with green color.

