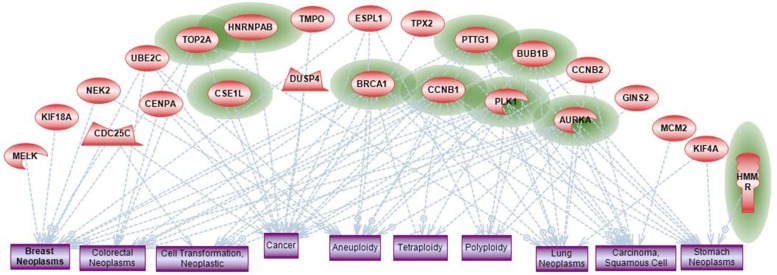
Figure 9.
Enrichment analysis of disease/phenotype categories.
Notes: Groups of genes (red nodes) from 44 gene intersection list were identified that are overrepresented among proteins associated with various disease phenotypes. Top 10 significantly overrepresented disease categories are shown as rectangular nodes (blue color). Genes that are significantly associated with metastasis phenotype (based on published data) are highlighted with green color.

