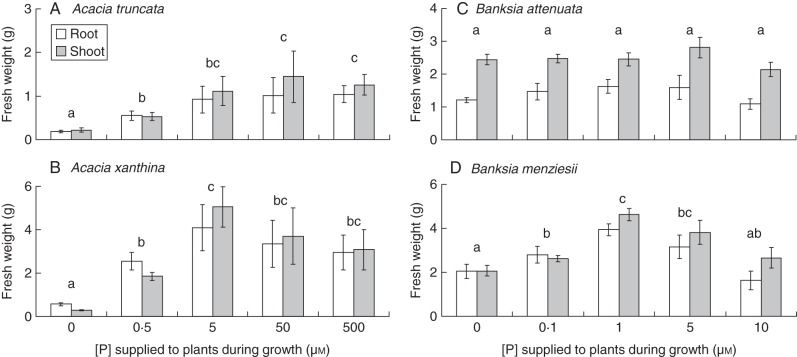
Fig. 1.
Effects of P concentration on fresh weight of (A) Acacia truncata, (B) A. xanthina, (C) Banksia attenuata and (D) B. menziesii. Plants were grown at five P concentrations (0, 0·5, 5, 50 and 500 µm P for Acacia, and 0, 0·1, 1, 5 and 10 µm P for Banksia) during 10 weeks in nutrient solution. Root and shoot fresh weights are as indicated in the key in (A). Bars indicate standard errors, n = 6. Letters above the bars indicate the pairwise comparison of means (P = 0·05) and show that roots and shoots reached a maximum fresh weight at an intermediate P concentration for three species. Banksia attenuata was the exception, showing no growth response to P supply. Note that the scales on the y-axes differ between panels.

