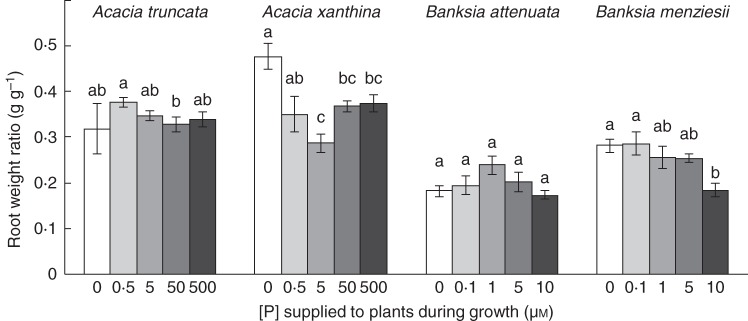
Fig. 2.

Effects of P concentration on root weight ratio (total root dry weight as a fraction of total plant dry weight) for Acacia truncata, A. xanthina, Banksia attenuata and B. menziesii grown at five P concentrations in nutrient solution (0, 0·5, 5, 50 and 500 µm P for Acacia, and 0, 0·1, 1, 5 and 10 µm P for Banksia). The root weight ratio of B. menziesii was the only one showing a significant decrease along P treatments (P < 0·001, n = 6). Letters above the bars indicate significant difference in a HSD Tukey test.
