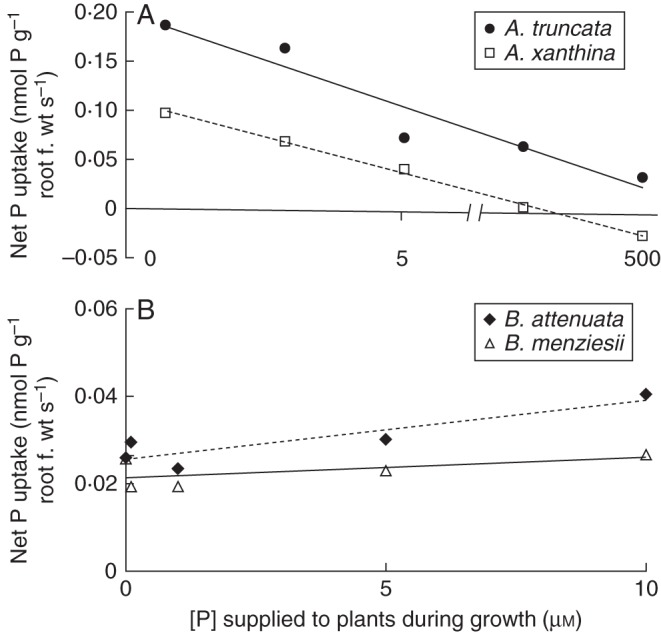
Fig. 4.

Net P-uptake rates calculated from P depletion from a standard solution containing 10 µm P (n = 6). The x-axis shows the P concentration ([P]) at which plants were grown for 10 weeks. (A) Net P-uptake rates of Acacia truncata and A. xanthina, as indicated. (B) P-uptake rate of Banksia attenuata and B. menziesii, as indicated. The difference between the two genera is statistically significant (significance value of 0·05), but that between the two species of the same genus is not. The equations for the fitted trendlines, R2 and significance levels are as follows: Acacia truncata [y = –0·02Ln(x) + 0·13; R2 = 0·96; P = 0·02]; Acacia xanthina [y = –0·01Ln(x) + 0·04; R2 = 0·79; P < 0·01]; Banksia attenuata (y = 0·001x + 0·03; R2 = 0·75; P = 0·05); Banksia menziesii (y = 0·0003x + 0·02; R2 = 0·13; P = 0·55). Note the difference in y-axis scale.
