Figure 1.

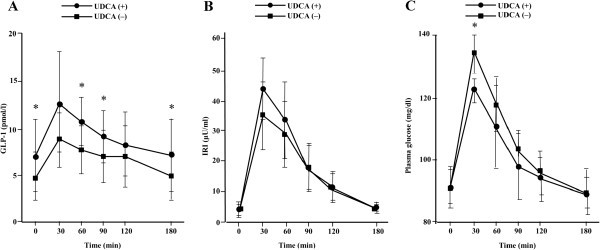
Results of meal test for (A) plasma glucose, (B) immunoreactive insulin, (C) active GLP-1. Data are means ± SD. Comparisons were performed using paired Student’s t-test or Wilcoxon signed rank test. * P < 0.05, without UDCA vs. with UDCA.

Results of meal test for (A) plasma glucose, (B) immunoreactive insulin, (C) active GLP-1. Data are means ± SD. Comparisons were performed using paired Student’s t-test or Wilcoxon signed rank test. * P < 0.05, without UDCA vs. with UDCA.