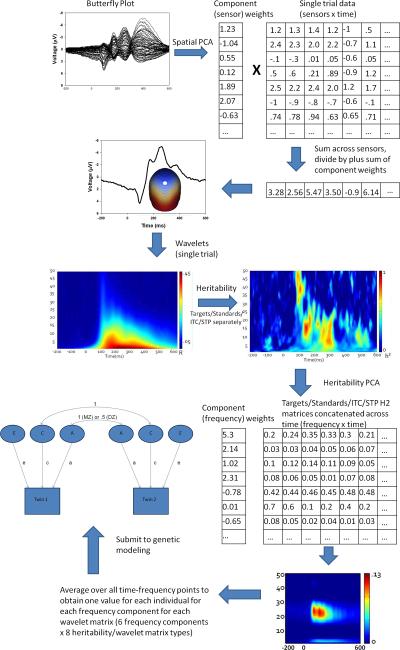
Figure 1.
Pictorial representation of data reduction methods utilized in this project, including matrix manipulation for spatial and heritability PCAs. Step 1 begins at the upper left corner (Butterfly plot) and proceeds in a serpentine, arrow-guided manner to the final step (Submit to genetic modeling).

