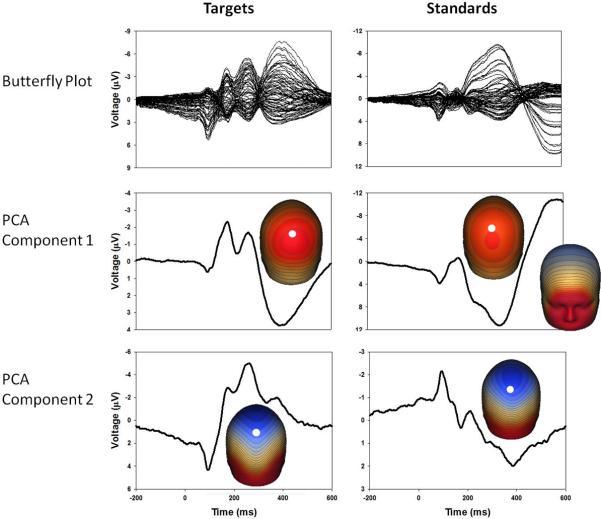
Figure 2.
Grand average butterfly plots, PCA component waveforms and component topographies for targets and standards. PCA component 1 for both conditions shows the largest deflection and has component topographies representative of late processing. PCA component 2 for both conditions has component topographies more representative of early stimulus registration. For orientation purposes, white dots on topographies indicate the position of sensor Pz.

