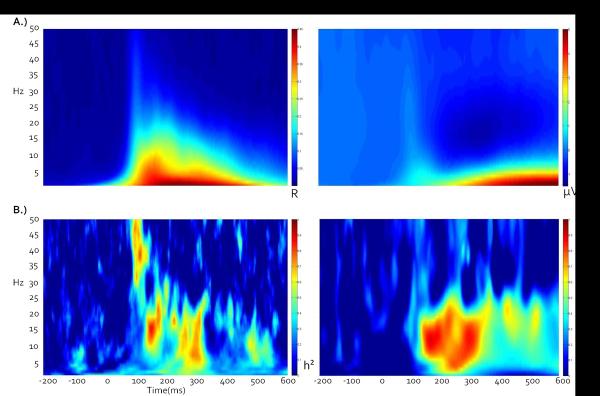
Figure 3.

A) Grand average ITC and STP time-frequency plots across all twins, conditions, and components indicate that early stimulus registration is primarily accompanied by an increase in ITC, while late processing primarily consists of a large low-frequency STP synchronization and corresponding beta desynchronization relative to baseline. B) Corresponding broad sense heritability plots, calculated point-by-point as twice the difference between MZ and DZ intraclass correlations. Note that peak heritability values do not necessarily correspond to peak ITC or STP amplitudes.
