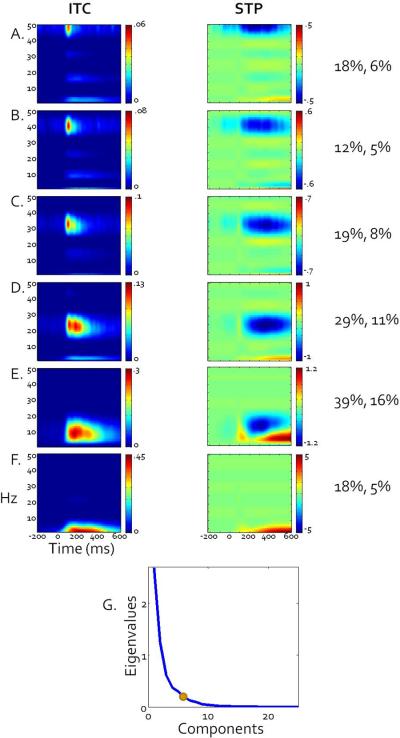
Figure 4.
Grand average ITC (left column) and STP (right column) plots weighted by broad sense heritability PCA components, revealing a data-driven distribution of frequency bands that closely resemble traditional bands defined in the EEG literature. Scale is provided for each plot but denotes weighted values so is not directly comparable with raw ITC or STP values. Percent variance accounted for by each rotated component, ignoring other components, followed by percent variance uniquely accounted for by each component, is presented to the right of each set of plots. A). High gamma. B). Low gamma. C). High beta. D). Low beta. E). Alpha. F). Theta/Delta G). Scree plot of unrotated eigenvalues. The dot indicates where the final component retained is located.

