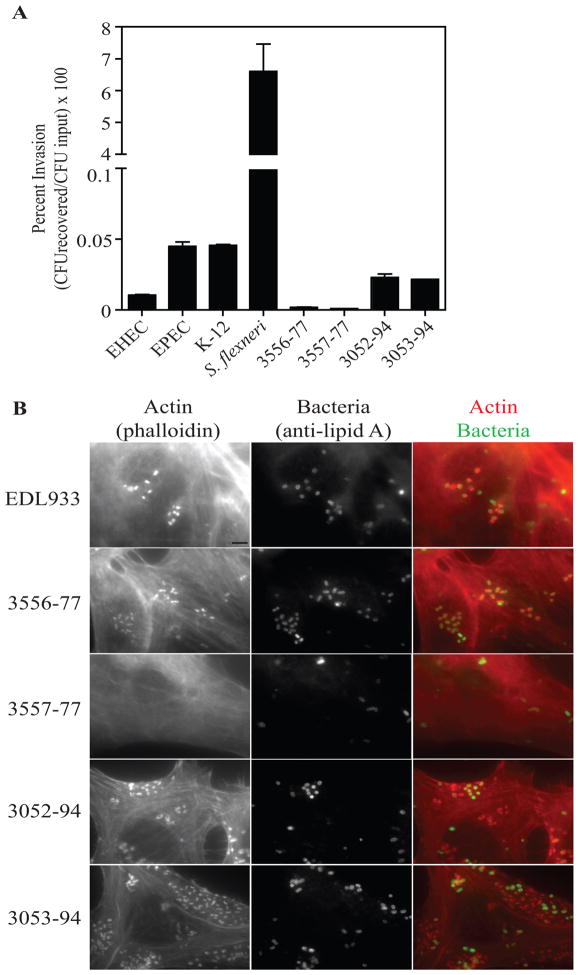
Figure 2. Invasion and pedestal formation of atypical Shigella B13 strains.
A, Percent HEp-2 invasion by E. coli O157:H7 EDL933 (EHEC), E. coli O127:H6 E2348/69 (EPEC), E. coli K12 MG1655, S. flexneri 5a M90T, and the atypical Shigella B13 strains 3556–77, 3557–77, 3052–94, and 3053–94 as determined by the gentamicin protection assay with duplicate samples in three independent experiments. Statistical analysis was preformed using a one-way ANOVA with a Tukey’s post hoc test. S. flexneri invasion is significantly different from all other strains (P<0.001). Invasion was not significantly different among all other strains (P>0.05). B, Pedestal formation of the atypical Shigella B13 strains and E. coli O157:H7 EDL933. Infected HEp-2 cells were fixed and permeabilized and were stained with anti-lipid A antibody, followed by anti-goat-Alexa 488 and phalloidin-Alexa 594 antibodies. The scale bar located in the lower right corner of the EDL933 actin field represents 5 μm and is applicable to all micrographs.

