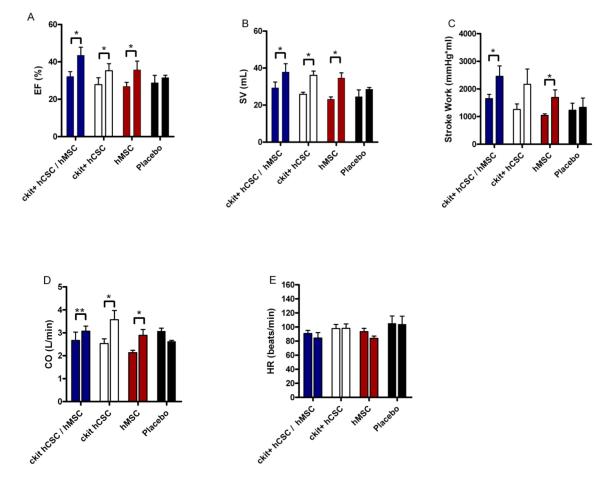
Figure 4.
Preload, afterload and contractility changes following hCSC and hMSC therapy. (A) Left ventricle end-diastolic pressure (LVEDP) and (B) end-diastolic volume (EDV) as well as afterload measured by (C) arterial elastance (Ea). Combination hCSC / hMSC therapy (n=5) improved contractility as measured by the (D) maximal rate of pressure change during systole (dP/dtmax) as well as (E) preload recruitable stroke work (PRSW), a preload independent measure of stroke work. There was no change in (F) systolic elastance (Ees), the slope of the end-systolic pressure volume relationship (ESPVR), in any of the groups. All graphs show pre-injection (2-weeks post-MI) vs. 4-weeks post-injection values. (*p<0.05 paired t-test; graphs represent mean±SEM)

