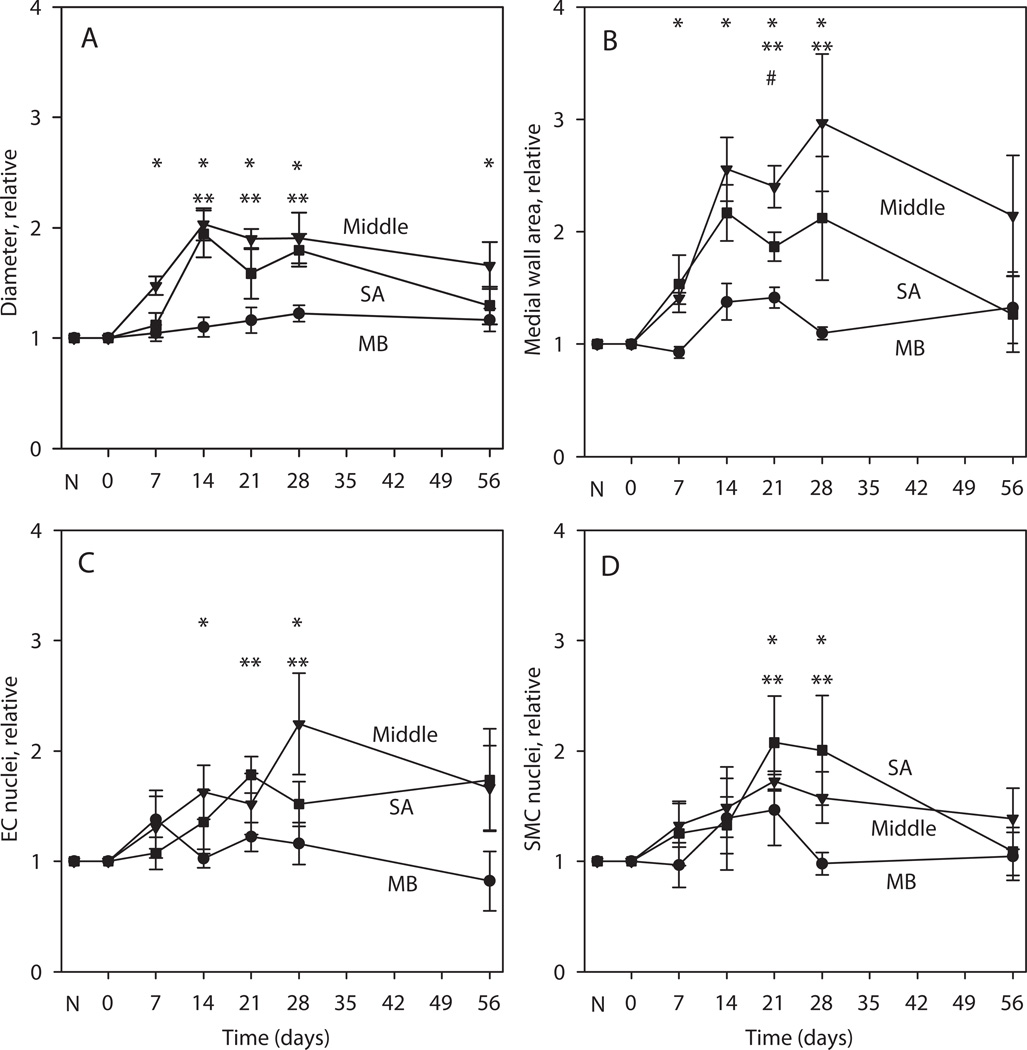
Figure 3.
Measured quantities as relative values of remodeled/normal values in the MB, middle and SA regions of the gracilis arteries. N denotes condition before surgery. Days 0–56 denote days after surgery. A. Diameter. B. Medial cross-section area. C. EC nuclei. D. SMC nuclei. #, * and ** indicate significantly different values from no change (1.0) in the MB, middle and SA regions respectively.

