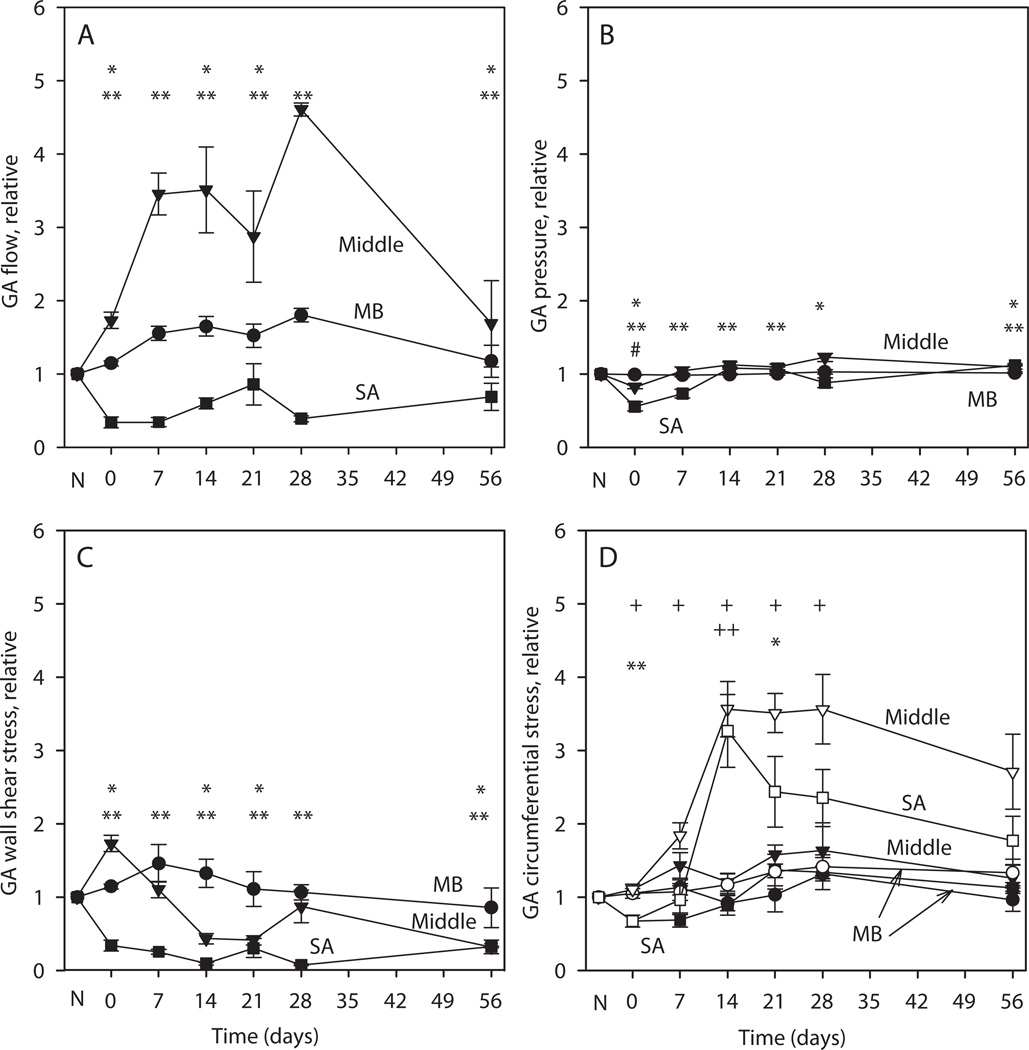
Figure 4.
Simulated hemodynamic parameters and mechanical stresses on the GA wall. All values are expressed as ratios of remodeled to contralateral control values, averaged over MB, middle and SA regions. N denotes condition before surgery. Days 0–56 denote days after surgery. A. Flow in gracilis artery. B. Pressure in artery, which drives flow in transverse arterioles. Immediately after surgery, the driving pressure in the injury region is reduced. C. Wall shear stress in artery. Immediately after surgery, wall shear stress is elevated in the middle region D. Circumferential wall shear stress. Open symbols: stress that would be generated with no change in medial area. Solid symbols: stress generated including the effect of changes in medial area. In A–D, #, * and ** indicate significantly different values from no change (1.0) in the MB, middle and SA regions respectively, including changes in medial area. In D, + and ++ denote significantly different values from no change (1.0) in the circumferential stress in the middle and SA regions respectively with no change in medial area.

