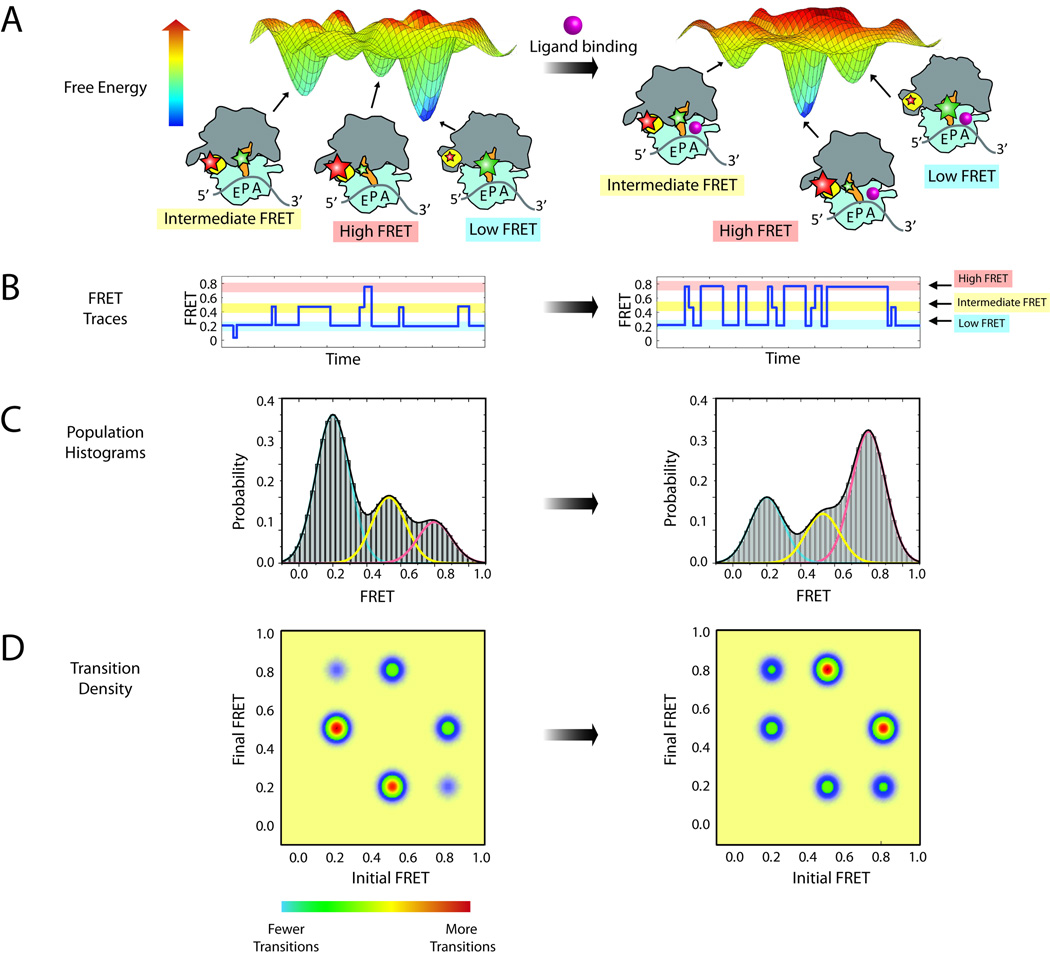
Figure 4.
Steady state measurements of dynamic processes within the ribosome. (A) A hypothetical energy landscape of a ribosome complex with a P-site tRNA. Three dominant populations of ribosome conformations correspond to the three largest energy basins on the energy landscape. Donor and acceptor fluorophores (green and red stars, respectively) can be attached to the ribosome to report on the lifetime of these states. The addition of ligand (pink sphere) may alter the energy landscape, thus changing the dynamic equilibrium of the complex. (B) Single-molecule traces of the ribosome complex before (left) and after (right) addition of ligand. Three FRET states can be observed: high FRET (red), intermediate FRET (yellow) and low FRET (blue). (C) Population histograms from summation of single-molecule traces shown in (B). Each population can be fitted with three Gaussians, corresponding to each of the three conformations. (D) Transition density plots showing the relative number of transitions between each state.

