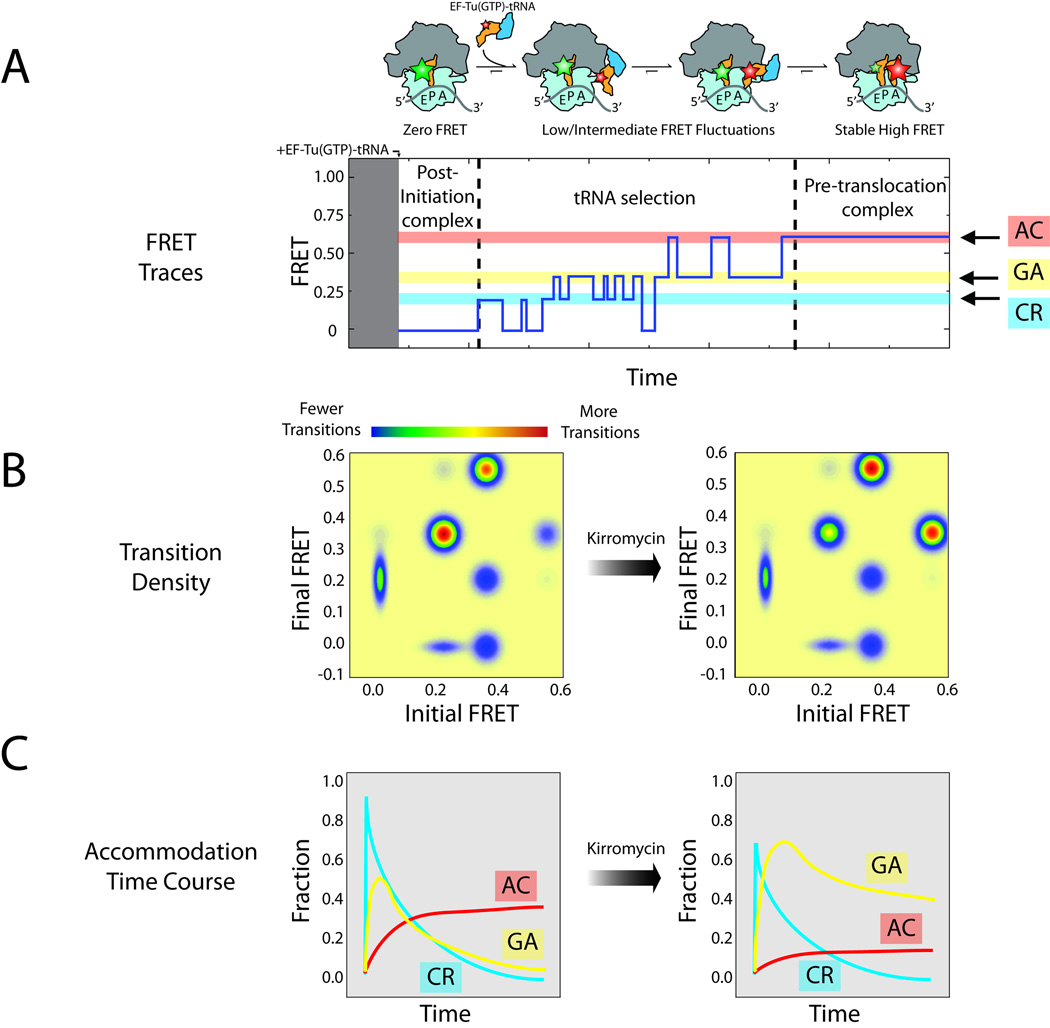
Figure 5.
Pre-steady state measurements of dynamic processes within the ribosome. (A) Cartoon illustrating the principal steps in tRNA selection. Donor and acceptor fluorophores can be attached to tRNAs to monitor this process using single-molecule FRET. Low, intermediate and high FRET states are observed, corresponding to codon recognition (CR, blue), GTPase activation (GA, yellow) and tRNA accommodation (AC, red). (B) A transition density plot can be calculated to illustrate changes in the number of transitions between each state before (left) and after (right) the addition of kirromycin, an antibiotic inhibiting the release of inorganic phosphate from EF-Tu after GTP hydrolysis. (C) Changes in AC, GA and CR populations over time.

