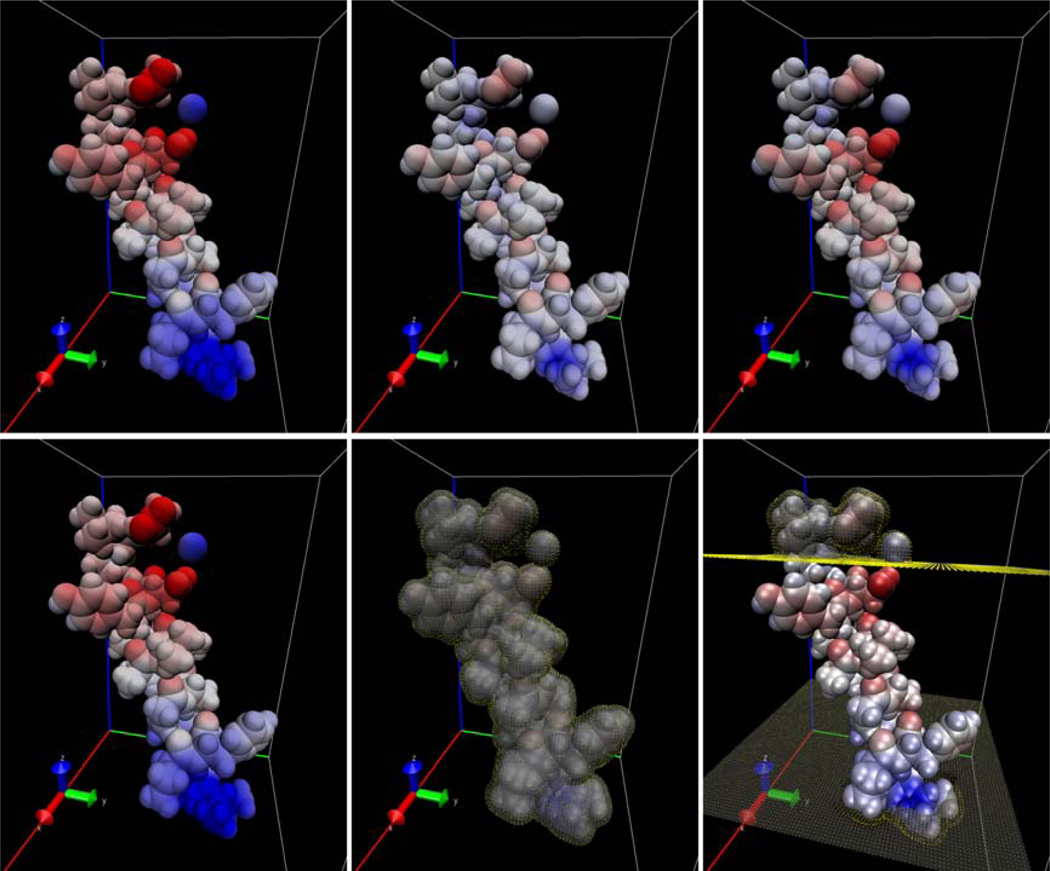
Figure 5. Electrostatic Potential Distribution (Kcal/Mol-E) And Boundary Grid Points For The Aquaporin Coil System.
Top: Electrostatic potential maps only. Bottom: Electrostatic potential maps overlaid with boundary grid points in yellow. Left: Vacuum System. Middle: Solvated in water + 20 Å slab-like membrane. Right: Solvated in water only.

