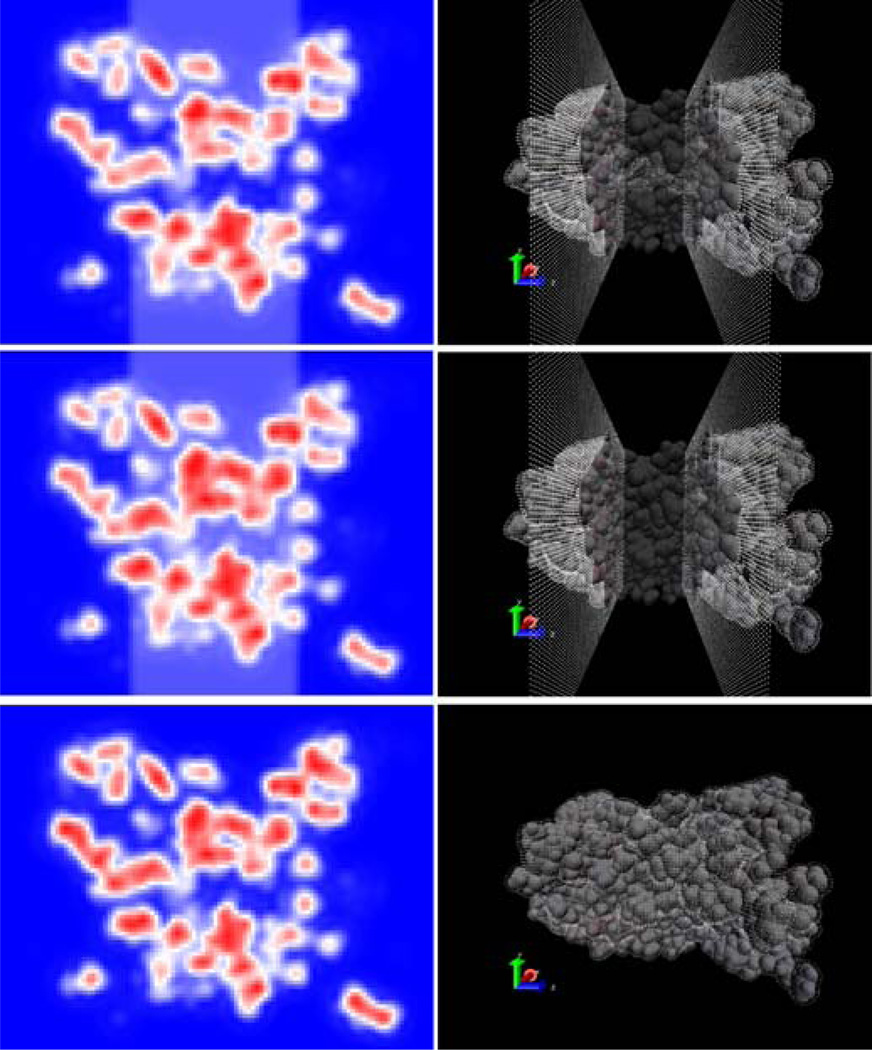
Figure 6. Cross-Sectional Distribution Of Level Set Density Function And Boundary Grid Points For The Aquaporin System.
Left: Cross-sectional distribution of the level set density function taken along the y-z plane through the center of the channel. Red indicates the solute region, white indicates the membrane region, and blue indicates the solvent region. Right: van der Waals surface of the aquaporin system overlaid with boundary grid points in white. The van der Waals surface is made transparent to allow viewing of buried boundary grid points. Top panels: Solvated in water + 20 Å membrane with a 6 Å cylindrical exclusion region. Middle panels: Solvated in water + 20 Å membrane. Bottom panels: Solvated in water.

