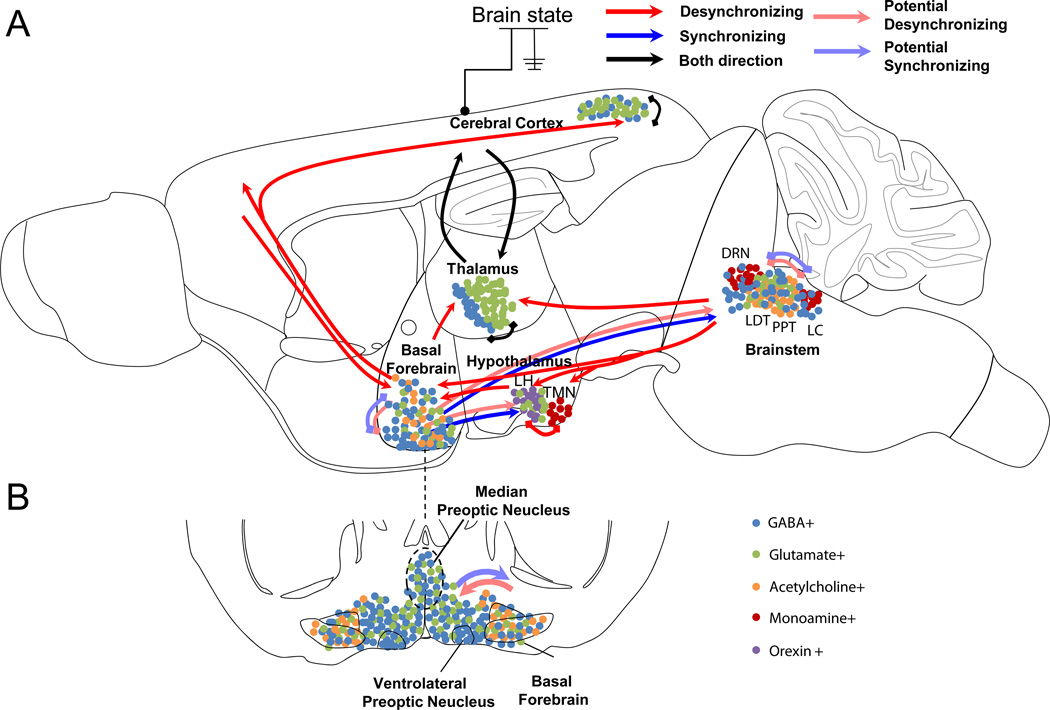
Figure 2. Schematic diagram showing the key circuits involved in regulating brain states.
A, Sagital view. Arrows indicate major pathways connecting the brain areas. Red arrow, pathway inducing cortical desynchronization; blue arrow, pathway inducing cortical synchronization, black arrow; pathway that mediate both synchronization and desynchronization; light red, possible pathway for desynchronization; light blue, possible pathway for synchronization. Each cell types were schematically illustrated by colored dots in each brain area. B, Coronal view of the basal forebrain/preoptic area, at the position indicated by dashed line in A. MnPO is in fact more anterior but outlined here for convenience.

