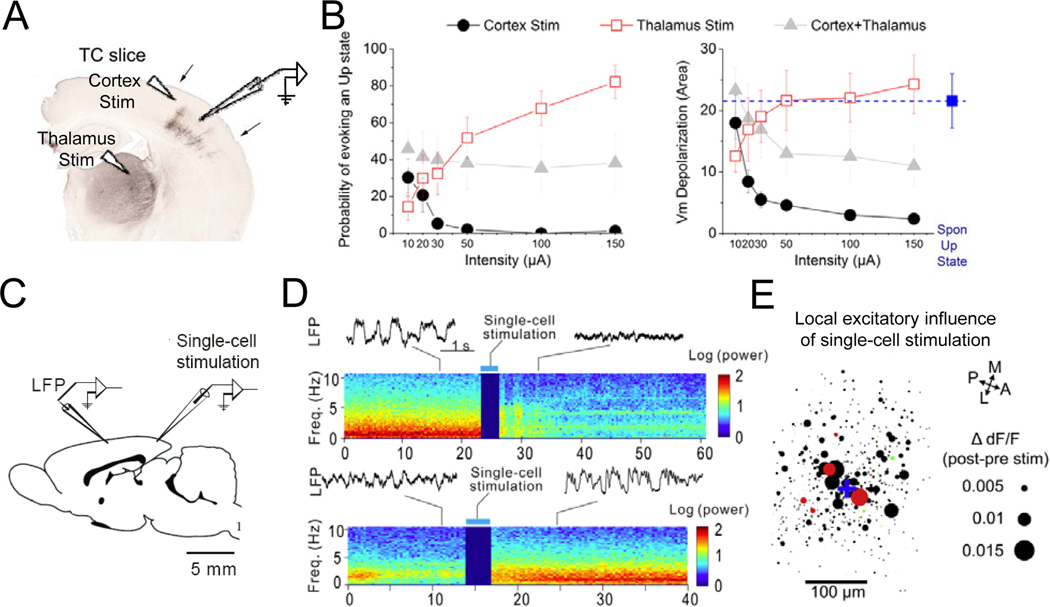
Figure 5. Effects of thalamic and cortical stimulation on brain states.
A, UP or DOWN states were measured in brain slices with intact thalamocortical circuits (TC slice). B, Population data showing probability of triggering a cortical UP state (left) and overall membrane potential depolarization measured by area (right) in response to stimulation of the thalamus, cortex, or both as a function of stimulation intensity. Figures adapted and reproduced with permission from Rigas and Castro-Alamancos, 2007. C, Schematic illustration of simultaneous whole-cell and LFP recordings measuring brain state change in response to single-cell stimulation. D, Brain state switch measured by change in LFP power spectrum from synchronized to desyncrhronized state or vice versa induced by single-cell stimulation (adapted from Li et al., 2009). E, Local excitatory influence of single-cell stimulation in the visual cortex. Blue cross, stimulated cell. Each circle represents a cell and the diameter represents the magnitude of excitation (ΔdF/Fpost-pre) measured by two-photon calcium imaging in layer 2/3 cortical neurons (red, SOM+; green, PV+; black, unidentified neurons; adapted from Kwan and Dan, 2012).

