
Figure 3.
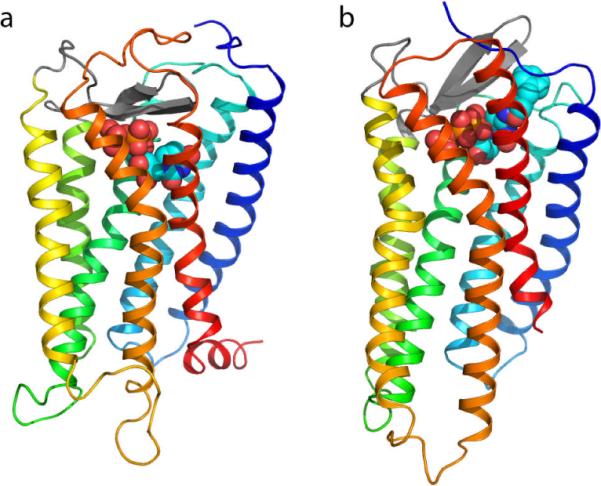
Side-by-side view of two P2Y4R models (Maruoka et al., 2011): an older rhodopsin-based model is shown in panel a, while a more recent CXCR4-based model is shown in panel b. The two models can be readily recognized by the distinctive structure of their second extracellular loop (EL2) domains – the beta-hairpins represented with thick gray antiparallel arrows. Specifically, in the rhodopsin-based model EL2 lays low over the extracellular opening of the helical bundle, while in the CXCR4-based model it projects towards the extracellular space. As a result, the docked ligand is pushed more deeply toward the center of the receptor in the first than in the latter. The structure of the receptors is schematically represented as a ribbon with a color gradient going from blue at the N-terminus to red at the C terminus (TM1: dark blue; TM2: cyan; TM3: green; TM4: yellow/green; TM5: yellow; TM6: orange, TM7: red). The ligands – UTP in the rhodopsin-based model, an N4-substituted derivative of CTP (MRS4062, N4-(3-phenylpropoxy)-cytidine-5'-triphosphate) in the CXCR4-based model – are represented as van der Waals spheres (orange, P; red, O).