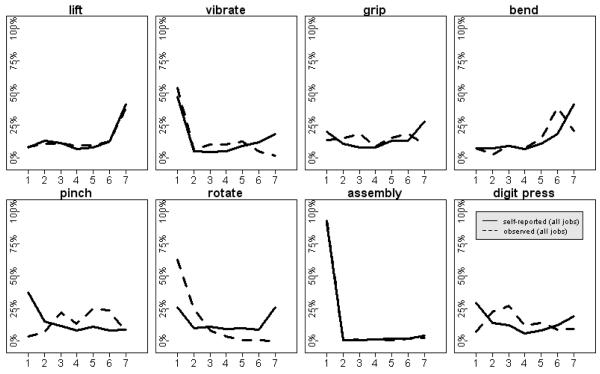
Figure 1.
Distribution of self-reported (solid lines) and observed (dashed lines) exposures for daily duration of time. Numbers on the horizontal axis represent time categories: none (1), less than five minutes (2), five to 30 minutes (3), more than 30 minutes but less than one hour (4), one to two hours (5), more than two hours but less than four hours (6), four or more hours (7) per day.

