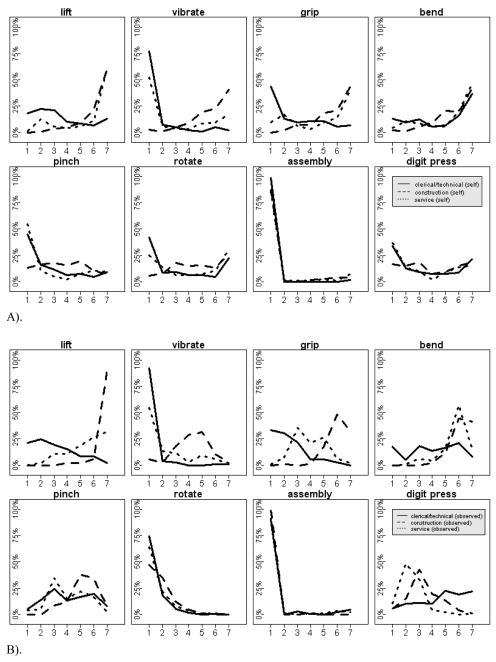
Figure 2.
Distribution of self-reported exposures for three job types: clerical/technical (solid lines), construction (dashed lines), and service (dotted lines) worker groups. A) shows the results from the self-reported exposures; B) shows the results from the observed exposures. Numbers on the horizontal axis represent the same information as in Figure 1.

